By: Ray Barley | Comments | Related: 1 | 2 | 3 | 4 | 5 | > Reporting Services Charts
Problem
I'm looking at several new visualization features in SQL Server 2008 R2 Reporting Services and the sparkline looks like something that I could really use. Can you provide an example of how to use this in a report?
Solution
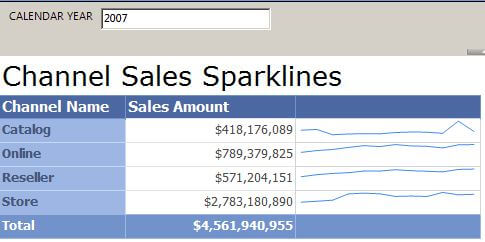
The sparkline is a new visualization that essentially provides a line chart within a single cell in a report. This enables you to easily see the trend of data values over a period of time. In this tip I will build the following report to demonstrate sparklines:
The report uses the following query to retrieve data from the ContosoRetailDW database:
SELECT d.CalendarMonth, c.ChannelName, sum(f.SalesAmount) SalesAmount
FROM dbo.FactSales f
JOIN dbo.DimDate d ON d.DateKey = f.DateKey
JOIN dbo.DimChannel c ON c.ChannelKey = f.ChannelKey
WHERE d.CalendarYear = @CALENDAR_YEAR
GROUP BY d.CalendarYear, d.CalendarMonth, c.ChannelName
ORDER BY c.ChannelName, d.CalendarYear, d.CalendarMonth
The important point to note is that we need multiple data points in order to render the sparkline. The above query will return the sum of SalesAmount for each month in a particular year for each ChannelName. When there are sales for a ChannelName in each month of the year there will be 12 rows. The report will sum all rows and present the total in the Sales Amount column but the sparkline will use the monthly sales total rows to render the line chart.
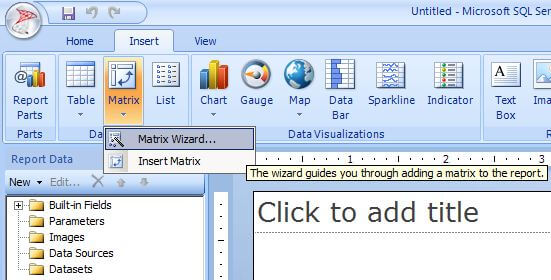
To build this report launch Report Builder 3 which is available for download on the SQL Server 2008 R2 Feature Pack site. Click the Insert tab and launch the Matrix Wizard as shown below:
The Matrix Wizard walks through setting up a matrix type of report where you can specify grouping on columns, grouping on rows, and what values to summarize. The wizard asks you to specify (or select) a data source and a dataset; then you get to the Arrange Fields dialog as shown below:
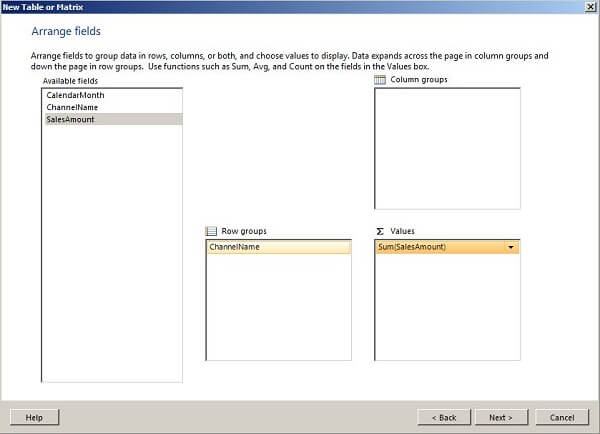
Drag and drop ChannelName onto the Row groups and SalesAmount onto the Values. Accept the default values on the remaining steps in the wizard and the report designer will display the matrix.
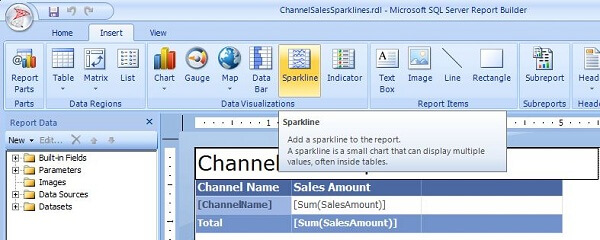
The last step is to add the sparkline to the report. Click Sparkline on the Insert tab as shown below:
Click on the cell in the matrix where you want to add the sparkline. You will be prompted to select the sparkline type as shown below:
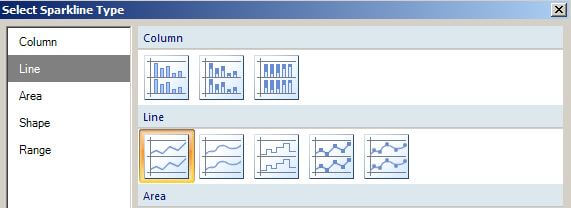
Choose the sparkline type then double click in the cell where you added the sparkline to display the Chart Data as shown below:
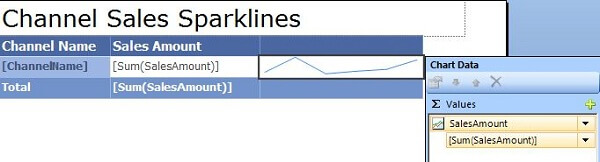
Click the + then add SalesAmount for the Values. This completes the report; run the report and you will see the following output:
Next Steps
- Sparklines are a new addition to SQL Server Reporting Services 2008 R2 and provide a nice way to spice up your reports with a bit of visualization.
- You can download the Contoso Retail DW sample database used in the report from this CodePlex site. Select ContosoBIdemobak.exe and follow the instructions for installing.
- You can download Report Builder 3 from the SQL Server 2008 R2 Feature Pack site.


About the author
 Ray Barley is a Principal Architect at IT Resource Partners and a MSSQLTips.com BI Expert.
This author pledges the content of this article is based on professional experience and not AI generated.
View all my tips
