By: Greg Robidoux | Updated: 2020-03-03 | Comments (4) | Related: > SQL Server Management Studio
Problem
Have you ever wondered where SQL Server Management Studio (SSMS) gets its information from and how you can retrieve the same data without using SSMS? Well it's not a big secret. Most of the information that is displayed in the GUI is based on information gathered from queries, but what queries? If you have ever looked at the system tables to try to figure this out, it is not as straight forward as you think. So how do you find out what queries SSMS is using?
Solution
One simple way of figuring this out is to use Profiler to capture the queries that are being executed and then you can use these same queries to gather the same information. It is a pretty straight forward process to use Profiler even if you have never used Profiler before.
The first step is to launch Profiler, this can be done one of two ways:
- Run Profiler (profiler.exe) either from the command line or from the menu
- or
- Launch Profiler from SQL Server Management Studio from Tools > SQL Server Profiler
Once you have Profiler launched you need to create a new trace. To do this follow the steps below.
- File > New Trace...
- Connect to the server and database
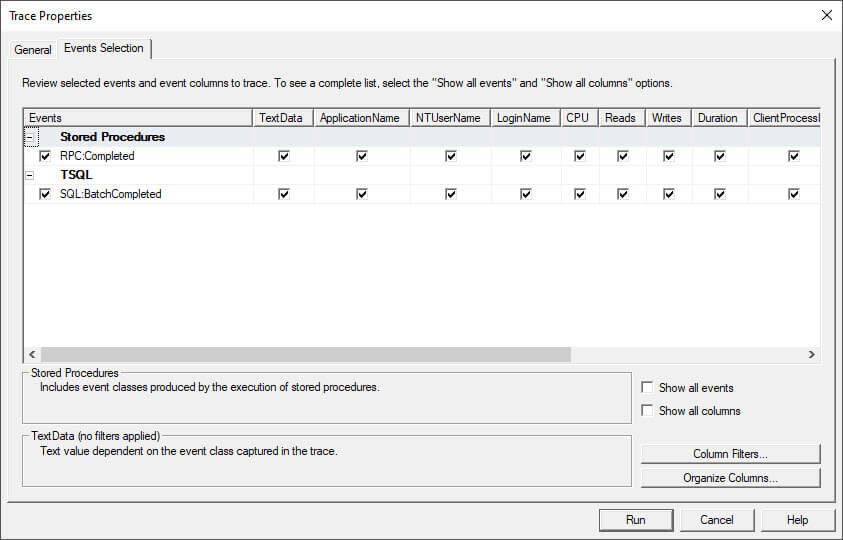
- Go to the Events Selection tab and select the following Events and Columns

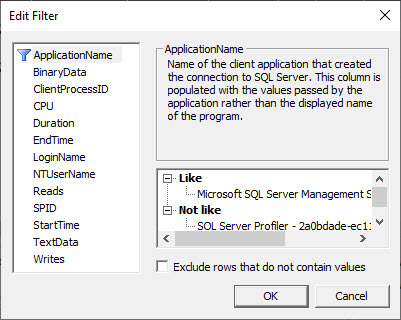
- Click on the Column Filters... button and enter "Microsoft SQL Server Management Studio%" in the Like section and click OK.

- Then click Run

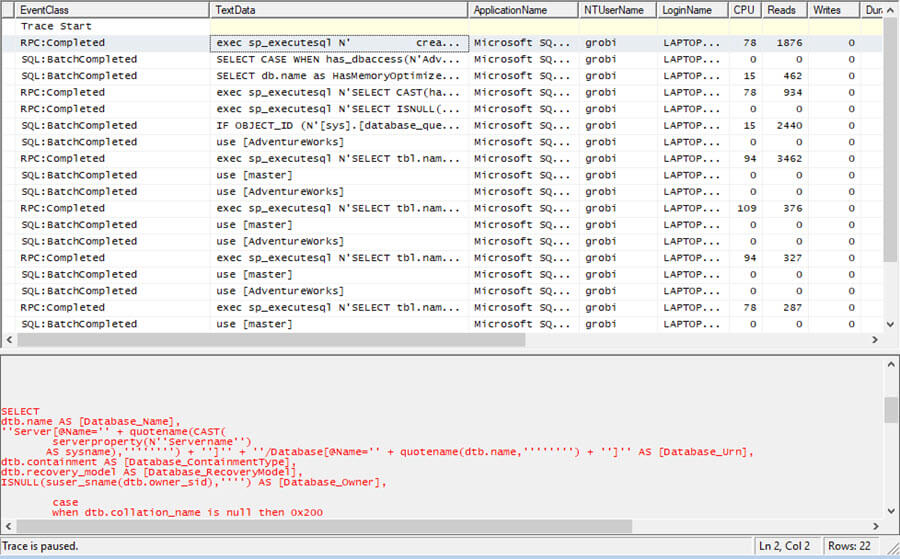
The following screen shows the queries that are being used by SSMS once you start clicking around in SSMS. Once you have the data you can either pause or stop the trace from running.

Based on the output from Profiler above we can see the below query that SSMS uses to get a list of databases.
EXEC Sp_executesql
  N'create table #tmp_db_hadr_dbrs (group_database_id uniqueidentifier, synchronization_state tinyint, is_local bit)
  declare @HasViewPermission int
  select @HasViewPermission = HAS_PERMS_BY_NAME(null, null, ''VIEW SERVER STATE'')
  if (@HasViewPermission = 1)
  begin
  insert into #tmp_db_hadr_dbrs select group_database_id, synchronization_state, is_local from master.sys.dm_hadr_database_replica_states
  end
  SELECT dtb.name AS [Database_Name],
  ''Server[@Name='' + quotename(CAST(serverproperty(N''Servername'') AS sysname),'''''''') + '']'' + ''/Database[@Name='' + quotename(dtb.name,'''''''') + '']'' AS [Database_Urn],
  dtb.containment AS [Database_ContainmentType],
  dtb.recovery_model AS [Database_RecoveryModel],
  ISNULL(suser_sname(dtb.owner_sid),'''') AS [Database_Owner],
  case when dtb.collation_name is null then 0x200 else 0 end |
  case when 1 = dtb.is_in_standby then 0x40 else 0 end |
  case dtb.state when 1 then 0x2
  				 when 2 then 0x8
  				 when 3 then 0x4
  				 when 4 then 0x10
  				 when 5 then 0x100
  				 when 6 then 0x20
  				 else 1 end AS [Database_Status],
  dtb.compatibility_level AS [Database_CompatibilityLevel],
  ISNULL(dmi.mirroring_role,0) AS [Database_MirroringRole],
  ISNULL(dmi.mirroring_state + 1, 0) AS [Database_MirroringStatus],
  dbrs.synchronization_state AS [Database_AvailabilityDatabaseSynchronizationState],
  0 AS [Database_HasMemoryOptimizedObjects],
  CAST(dtb.is_remote_data_archive_enabled AS bit) AS [Database_RemoteDataArchiveEnabled],
  CAST(case when SERVERPROPERTY(''EngineEdition'') = 6 then cast(1 as bit) else cast(0 as bit) end AS bit) AS [Database_IsSqlDw],
  dtb.recovery_model AS [RecoveryModel],
  dtb.user_access AS [UserAccess],
  dtb.is_read_only AS [ReadOnly],
  dtb.name AS [Database_DatabaseName2],
  dtb.name AS [Database_DatabaseName3]
  FROM master.sys.databases AS dtb
  LEFT OUTER JOIN sys.database_mirroring AS dmi
  	ON dmi.database_id = dtb.database_id
  LEFT OUTER JOIN #tmp_db_hadr_dbrs AS dbrs
  	ON dtb.group_database_id = dbrs.group_database_id
  	and dbrs.is_local = 1
  WHERE (CAST(case when dtb.name in (''master'',''model'',''msdb'',''tempdb'') then 1 else dtb.is_distributor end AS bit)=@_msparam_0
  and CAST(isnull(dtb.source_database_id, 0) AS bit)=@_msparam_1)
  ORDER BY [Database_Name] ASC
  drop table #tmp_db_hadr_dbrs',
  N'@_msparam_0 nvarchar(4000),@_msparam_1 nvarchar(4000)',
  @_msparam_0=N'0',
  @_msparam_1=N'0'
Next Steps
- Setup Profiler to capture events and then start clicking away in SSMS to see what is actually happening behind the scenes to help you learn how to write your own queries from the system tables and views.
- If there is a lot of activity on the server, you can use additional filters to capture data for specific databases or users.
About the author
 Greg Robidoux is the President and founder of Edgewood Solutions, a technology services company delivering services and solutions for Microsoft SQL Server. He is also one of the co-founders of MSSQLTips.com. Greg has been working with SQL Server since 1999, has authored numerous database-related articles, and delivered several presentations related to SQL Server. Before SQL Server, he worked on many data platforms such as DB2, Oracle, Sybase, and Informix.
This author pledges the content of this article is based on professional experience and not AI generated.
View all my tips
Article Last Updated: 2020-03-03


