By: MSSQL Tips | Updated: 2007-02-14 | Comments | Related: > Performance Tuning
Problem
Finding a good reporting mechanism for your SQL Server environment can be tedious and time-consuming-you can either write your own reporting application or choose a third-party solution. You may also have to install an instance of Reporting Services in your environment, depending on the needs of the application. SQL Server 2005 includes a number of built-in reports to assist you in troubleshooting and measuring performance.
Solution
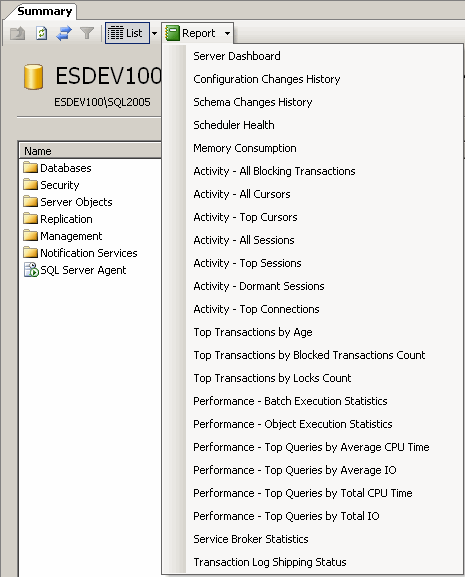
As part of the installation of SQL Server 2005 a number of performance-related reports are installed. To get to these reports open the SQL Server Management Studio (SSMS) and connect to a SQL Server 2005 instance. If you don't have an instance of Reporting Services installed then the icon will be disabled. Once connected, click on the server name and the Reports button in the Summary section on the right will enable:

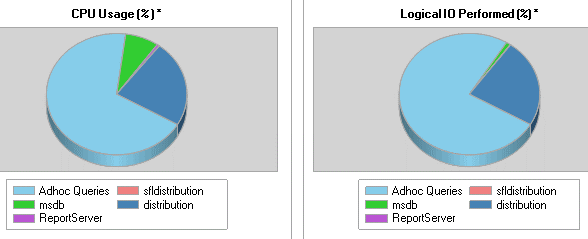
When you click on the actual Reports button, the server generates a dashboard report, consisting of CPU Usage and Logical I/O Performed. These results are shown as pie charts:

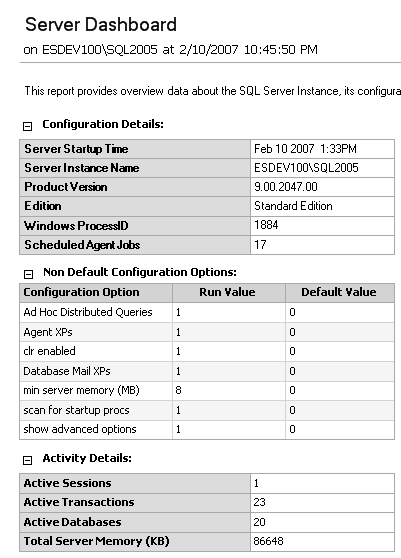
In addition, there is other information, like product version and configuration settings:

If you click on the arrow to the right of the Reports button, a number of other reports are displayed:

| Report name | Description |
|---|---|
| Configuration Changes History | Shows all sp_configure and Trace Flag changes made |
| Schema Changes History | Shows all DDL statements executed on the server |
| Scheduler Health | Shows detailed information on each scheduler instance |
| Memory Consumption | Shows memory usage by various components (i.e., Memory Clerk, Cache Store, User Store) |
| Activity - All Blocking Transactions | Shows all transactions that are blocking others |
| Activity - All Cursors | Provides information on cursors by Sessions ID |
| Activity - Top Cursors | Provides information on the Top 10 cursors that utilize the most CPU time and IO |
| Activity - All Sessions | Provides information on all open sessions |
| Activity - Top Sessions | Provides information on sessions that are oldest, use the most CPU time, number of reads or writes |
| Activity - Dormant Sessions | Shows users with sessions older than one hour |
| Top Transactions By Age | Shows the longest running transactions |
| Top Transactions By Blocked Transaction Count | Shows transactions that are blocking the most transactions |
| Top Transactions By Locks Count | Shows the transactions holding the most significant locks |
| Performance - Batch Execution Statistics | Shows information on batch statements currently in cache |
| Performance - Object Execution Statistics | Shows information on object execution plans in cache |
| Performance - Top Queries By Average CPU Time | Shows information on queries in cache that have the highest average CPU time |
| Performance - Top Queries By Average IO | Shows information on queries in cache that have utilized the highest average IO |
| Performance - Top Queries By Total CPU Time | Shows information on queries in cache that have the highest total CPU time |
| Performance - Top Queries By Total IO | Shows information on queries in cache that have the highest total IO |
| Service Broker Statistics | Provides basic information on Transport, Network Connections, and Forwarded Messages by the Service Broker instance |
| Transaction Log Shipping Status | Provides the status of log shipping on the instance (for primary, secondary, and monitoring servers) |
Next Steps
- Investigate the new built-in reports in SQL Server 2005 and incorporate them into your troubleshooting repertoire
- Read more about Reporting Services in SQL Server 2005
- Read more tips on Performance Tuning and Reporting Services
About the author
 MSSQLTips.com was started in 2006 to provide SQL Server content about various aspects of SQL Server and other database platforms.
This author pledges the content of this article is based on professional experience and not AI generated.
View all my tips
Article Last Updated: 2007-02-14


