By: Jeremy Kadlec | Updated: 2007-04-13 | Comments (4) | Related: 1 | 2 | 3 | 4 | 5 | 6 | > Locking and Blocking
Problem
I have read your tip on SQL Server locking, blocking and deadlocking (Finding and troubleshooting SQL Server deadlocks) which are applicable to some of issues I have been recently facing. I have been noticed locking on my SQL Server and have heard about the issues from my users. I have been trying to troubleshoot it, unfortunately, I have been having a hard time understanding the issues with large deadlock chains. Does SQL Server have any way of identifying, understanding and trouble shooting deadlocks other than your previous tip (Finding and troubleshooting SQL Server deadlocks)?
Solution
That is a great question and can be a serious problem with a complex deadlock chain. In both SQL Server 2000 and SQL Server 2005, the Trace Flag 1204 and Profiler have the ability capture the results of a deadlock as outlined in the Finding and troubleshooting SQL Server deadlocks tip. One SQL Server 2005 Profiler feature that was not covered in the previous tip is graphically reviewing the deadlock in Profiler. This information may be what you are looking for to help analyze your issue to begin to resolve the issue. As such, below outlines the steps to capture the graphical deadlock from Profiler in a SQL Server 2005 instance.
Profiler Setup - Graphical Deadlock Chains
| ID | Description | Screen Shot |
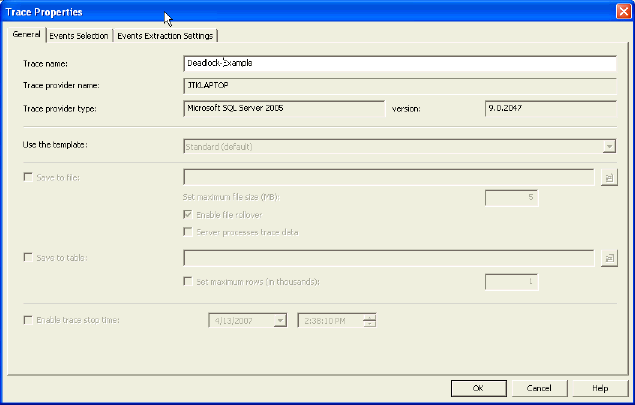
| 1 | General Tab - Specify the name, template and save location (table or file). |
|
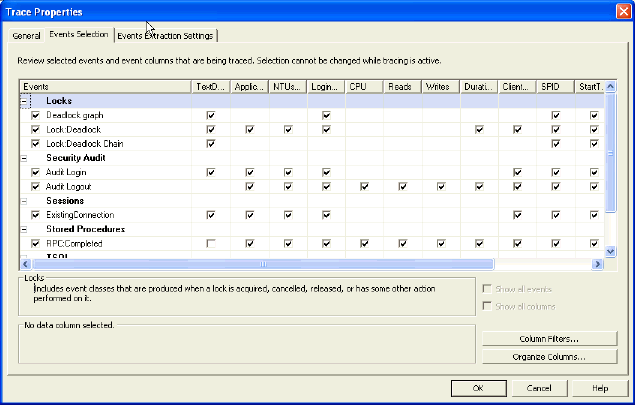
| 2 | Events Selection Tab - Specify the deadlock graph, Lock:Deadlock and Lock:Deadlock Chain events in addition to any other counters desired.
Press the 'OK' button to start the data collection. |
|
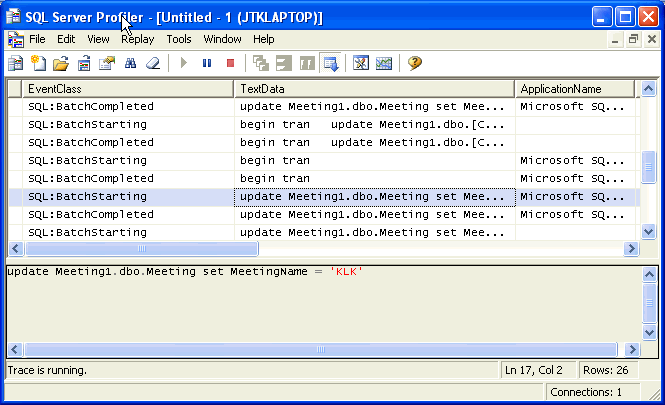
| 3 | Profiler Execution - Review the data captured from Profiler based on the counters that were selected. |
|
For additional tips on Profiler check these out:
Profiler Results - Graphical Deadlock
| ID | Description | Screen Shot |
| 1 | Deadlock Graph - Based on the queries that are issued, the deadlock chain will graphically show, the locking conflict, the completed spid and failed spid.
In this circumstance, the locking was at a key level, but based on your deadlock situation may be much different. |
 |
Next Steps
- Deadlocks can be a serious performance issue and if severe enough can significantly degrade your SQL Server performance.
- If you are experiencing significant deadlock issues, it is necessary to capture the necessary information to begin the analysis process.
- Based on the deadlock scenario, you may need to do design, develop, test and implement one or more of the following:
- Reschedule batch processes or reschedule competing processes trying to access the same data
- Change the order for table access in the queries to ensure they are the same
- Determine if the explicit transactions are unnecessarily extending transactions
- Build indexes to support the needed queries
- MSSQLTips.com - Index Category
- Perform maintenance to improve data access
- MSSQLTips.com - Maintenance Category
- Rather than using a home grown incrementing process for columns like primary keys, convert to using identities
- Split reporting from OLTP databases so these 2 very different types of processes do not compete with one another
- Reduce the amount of data (via a WHERE clause as an example) that is sent to the front end application if it is not reviewed on the screen by the users (i.e. return 10,000 rows and only display 10 results)
- Be sure to thoroughly test the solution you implement to ensure it will not have any negative impacts on other portions of the application.
About the author
 Jeremy Kadlec is a Co-Founder, Editor and Author at MSSQLTips.com with more than 300 contributions. He is also the CTO @ Edgewood Solutions and a six-time SQL Server MVP. Jeremy brings 20+ years of SQL Server DBA and Developer experience to the community after earning a bachelor's degree from SSU and master's from UMBC.
This author pledges the content of this article is based on professional experience and not AI generated.
View all my tips
Article Last Updated: 2007-04-13


