By: Jeremy Kadlec | Updated: 2008-02-21 | Comments (2) | Related: > Microsoft Excel Integration
Problem
Our business users are very savvy with Microsoft Excel. The issue we struggle with is getting the SQL Server data to them in a streamlined manner. We are familiar with some of your earlier tips related to integrating Microsoft Excel and SQL Server. We have gone down the paths and they have been helpful for a number of standardized reports. Now that the users can see the data, we are getting a number of requests to modify reports on a daily basis. Unfortunately, we do not have the staff to support all of the reporting needs. Do you have any suggestions to conduct SQL Server reporting directly with Microsoft Excel from a user perspective?
Solution
That is a great question. A number of tips have been written on MSSQLTips.com (Export data from SQL Server to Excel, Different Options for Importing Data into SQL Server, Insert data from Excel to SQL Server 2005 by using copy and paste commands, etc.) related to SQL Server and Microsoft Excel integration. More options are available in the marketplace natively with Microsoft Office, SQL Server, Reporting Services and third party tools. In this tip let's work through setting up a PivotTable in Microsoft Excel 2003 from data in the SQL Server 2005 AdventureWorks database. In a nutshell, we will do the following:
- Setup connection between Microsoft Excel and SQL Server
- Define the data, report definition and layout
- Save the report for re-execution or future modification
How to setup Microsoft Excel reporting with SQL Server
Below outlines the detailed steps to create a Microsoft Excel PivotTable accessing data in SQL Server:
Microsoft Excel Reporting from a SQL Server Database
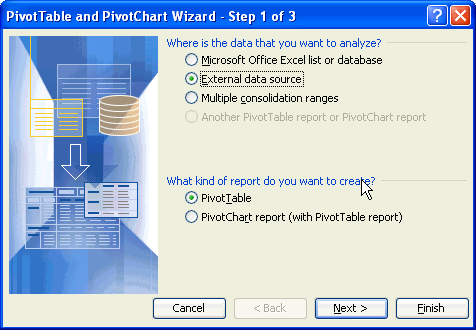
Step 1 - To start the PivotTable and PivotChart Wizard, open Excel and navigate to the 'Data' menu and select the 'PivotTable and PivotChart Report...' option.To interact with SQL Server, select the 'External data source' radio button.
Press the 'Next >' button to continue the process.

Step 2 - Press the 'Get Data...' option to retrieve the data.


Step 4 - Validate Microsoft Query installs properly.

Step 7 - Select the SQL Server and authentication mode (Windows
or SQL Server). For an expanded set of options (Database, Language, etc.),
click the 'Options >>' button.
Step 9 - Select the columns from the applicable table(s) or
view(s) to outline what data is included in the report.
Step 11 - If necessary, data can be filtered on a per column
basis.
Step 13 - Select the data interface.
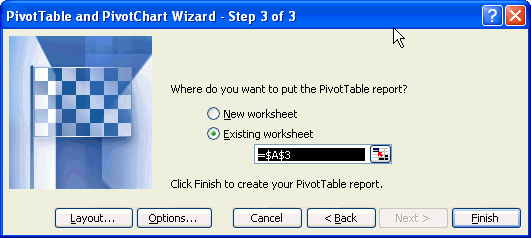
Step 17 - Choose the radio button for the appropriate worksheet
and once the 'Layout...' and 'Options...' buttons have been configured, select the
'Finish' button to generate the PivotTable.
Step 20 - Final PivotTable with the PivotTable Field List to
modify the report.Step 5 - Select the '<New Data Source>' option to create a new
data source.

Step 6 - Define the terms of the data source.


Step 8 - Below outlines the completed Create New Data Source interface.


Step 10 - If you press the 'Options...' button from the interface
above will provide the types of objects to include in the report. 

Step 12 - If necessary, the data can be sorted by a number of columns.


Step 14 - From the interface above, if you select the 'Save
Query...' button the interface below will appear to complete the process.

Step 15 - As the interfaces above are being completed, Microsoft
Query will be executed and can be reviewed to see the query, WHERE clause criteria
and sample data set.

Step 16 - Once the data has been retrieved, press the 'Next >' button.


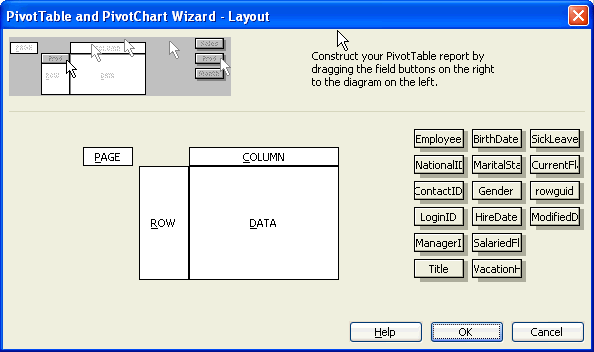
Step 18 - If you select the 'Layout...' button from the interface above,
you will be able to drag and drop the column to the page, row, column or data portions
of the interface.

Step 19 - If you select the 'Options...' button from the interface
(Step 18) above you will have the following options. 

Next Steps
About the author
 Jeremy Kadlec is a Co-Founder, Editor and Author at MSSQLTips.com with more than 300 contributions. He is also the CTO @ Edgewood Solutions and a six-time SQL Server MVP. Jeremy brings 20+ years of SQL Server DBA and Developer experience to the community after earning a bachelor's degree from SSU and master's from UMBC.
This author pledges the content of this article is based on professional experience and not AI generated.
View all my tips
Article Last Updated: 2008-02-21


