By: Ben Snaidero | Updated: 2012-02-07 | Comments (11) | Related: > Performance Tuning
Problem
In an ideal world all of our queries would be optimized before they ever make it to a production SQL Server environment, but this is not always the case. Smaller data sets, different hardware, schema differences, etc. all effect the way our queries perform. This tip will look at a method of automatically collecting and storing poor performing SQL statements so they can be analyzed at a later date.
Solution
With the new Dynamic Management Views and functions available starting in SQL Server 2005, capturing information regarding the performance of you SQL queries is a pretty straightforward task. The following view and functions give you all the information you need to determine how the SQL in you cache is performing:
Using the view and functions above we can create a query that will pull out all the SQL queries that are currently in the cache. Along with the query text and plan we can also extract some important statistics on the performance of the query as well as the resources used during execution. Here is the query:
SELECT TOP 20
    GETDATE() AS "Collection Date",
    qs.execution_count AS "Execution Count",
    SUBSTRING(qt.text,qs.statement_start_offset/2 +1,
                 (CASE WHEN qs.statement_end_offset = -1
                       THEN LEN(CONVERT(NVARCHAR(MAX), qt.text)) * 2
                       ELSE qs.statement_end_offset END -
                            qs.statement_start_offset
                 )/2
             ) AS "Query Text",
     DB_NAME(qt.dbid) AS "DB Name",
     qs.total_worker_time AS "Total CPU Time",
     qs.total_worker_time/qs.execution_count AS "Avg CPU Time (ms)",
     qs.total_physical_reads AS "Total Physical Reads",
     qs.total_physical_reads/qs.execution_count AS "Avg Physical Reads",
     qs.total_logical_reads AS "Total Logical Reads",
     qs.total_logical_reads/qs.execution_count AS "Avg Logical Reads",
     qs.total_logical_writes AS "Total Logical Writes",
     qs.total_logical_writes/qs.execution_count AS "Avg Logical Writes",
     qs.total_elapsed_time AS "Total Duration",
     qs.total_elapsed_time/qs.execution_count AS "Avg Duration (ms)",
     qp.query_plan AS "Plan"
FROM sys.dm_exec_query_stats AS qs
CROSS APPLY sys.dm_exec_sql_text(qs.sql_handle) AS qt
CROSS APPLY sys.dm_exec_query_plan(qs.plan_handle) AS qp
WHERE
     qs.execution_count > 50 OR
     qs.total_worker_time/qs.execution_count > 100 OR
     qs.total_physical_reads/qs.execution_count > 1000 OR
     qs.total_logical_reads/qs.execution_count > 1000 OR
     qs.total_logical_writes/qs.execution_count > 1000 OR
     qs.total_elapsed_time/qs.execution_count > 1000
ORDER BY
     qs.execution_count DESC,
     qs.total_elapsed_time/qs.execution_count DESC,
     qs.total_worker_time/qs.execution_count DESC,
     qs.total_physical_reads/qs.execution_count DESC,
     qs.total_logical_reads/qs.execution_count DESC,
     qs.total_logical_writes/qs.execution_count DESC
This query can be easily modified to capture something specific if you are looking to solve a particular problem. For example, if you are currently experiencing an issue with CPU on you SQL instance you could alter the WHERE clause and only capture SQL queries where the worker_time is high. Similarly, if you were having an issue with IO, you could only capture SQL queries where the reads or writes are high. Note: The ORDER BY clause is only needed if you keep the TOP parameter in your query. For reference I've included below an example of the output of this query.
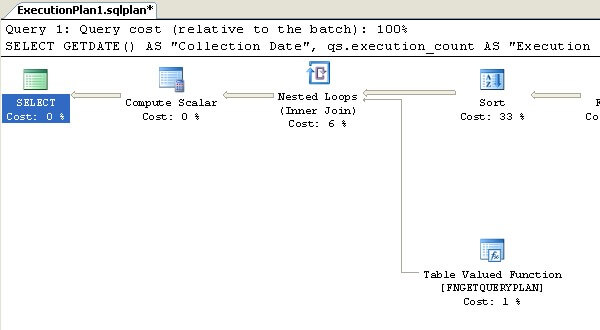
Also, if you click on the data in the "Plan" column it will display the execution plan in graphical format in a new tab.

Now that we have a query to capture what we are looking for, we need somewhere to store the data. The following table definition can be used to store the output of the above query. We just have to add this line ahead of the query above to take care of inserting the result, "INSERT INTO [DBA].[dbo].[My_Poor_Query_Cache]".
CREATE TABLE [DBA].[dbo].[My_Poor_Query_Cache] (
 [Collection Date] [datetime] NOT NULL,
 [Execution Count] [bigint] NULL,
 [Query Text] [nvarchar](max) NULL,
 [DB Name] [sysname] NULL,
 [Total CPU Time] [bigint],
 [Avg CPU Time (ms)] [bigint] NULL,
 [Total Physical Reads] [bigint] NULL,
 [Avg Physical Reads] [bigint] NULL,
 [Total Logical Reads] [bigint] NULL,
 [Avg Logical Reads] [bigint] NULL,
 [Total Logical Writes] [bigint] NULL,
 [Avg Logical Writes] [bigint] NULL,
 [Total Duration] [bigint] NULL,
 [Avg Duration (ms)] [bigint] NULL,
 [Plan] [xml] NULL
) ON [PRIMARY]
GO
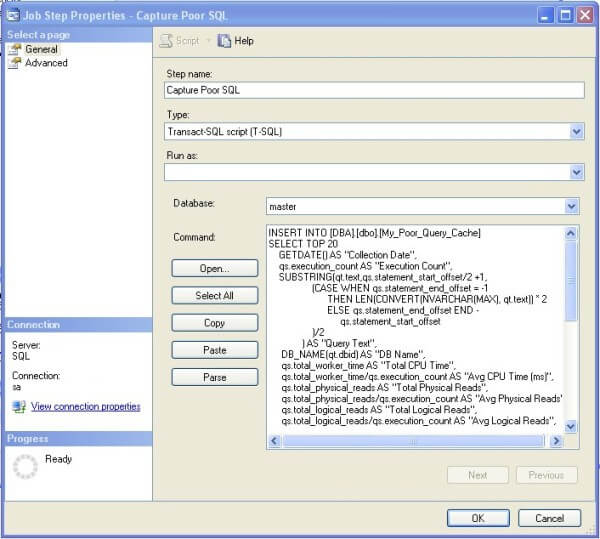
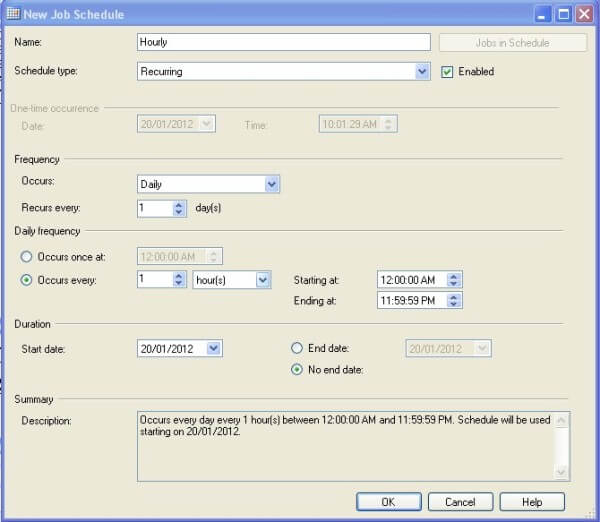
Finally, we'll use the SQL Server Agent to schedule this query to run. Your application and environment will determine how often you want to run this query. If queries stay in your SQL cache for a long period of time then this can be run fairly infrequently, however if the opposite is true they you may want to run this a little more often so any really poor SQL queries are not missed. Here are a few snapshots of the job I created. The T-SQL to create this job can be found here.


That's it. Now, whenever you have spare time you can query this table and start tuning.
Next Steps
- Investigate options for deploying solution to multiple servers
- Learn how to optimize a query
- Learn how to analyze query plans
About the author
 Ben Snaidero has been a SQL Server and Oracle DBA for over 10 years and focuses on performance tuning.
This author pledges the content of this article is based on professional experience and not AI generated.
View all my tips
Article Last Updated: 2012-02-07


