By: Rajendra Gupta | Updated: 2012-06-12 | Comments (1) | Related: > Functions System
Problem
SQL Server 2012 introduces new analytical functions PERCENT_RANK and CUME_DIST. In this tip we will explore these functions and how to use them.
Solution
PERCENT_RANK() : this represents the percentage of values less than the current value in the group, excluding the highest value. Percent_Rank() for the highest value in a group will always be 1.
CUME_DIST() : this gives the percentage of values less than or equal to the current value in the group. This is called the cumulative distribution.
Syntax of these functions are :
CUME_DIST | PERCENT_RANK OVER ( [ partition_by_clause ] order_by_clause )
Let me explain using an example.
Create a EmpSalary table on database TestDB and insert some data:
CREATE DATABASE [TestDB]

--Create testable to hold some data
Use TestDB
Go
CREATE TABLE [dbo].[EmpSalary](
 [Department] [nchar](10) NULL,
 [EmpName] [nchar](10) NULL,
 [Salary] [int] NULL
) ON [PRIMARY]
GO
--Insert some test data to apply these functions
insert into [EmpSalary] values('IT','Emp1',87)
insert into [EmpSalary] values('IT','Emp2',45)
insert into [EmpSalary] values('IT','Emp3',89)
insert into [EmpSalary] values('IT','Emp4',87)
insert into [EmpSalary] values('OPS','Emp1',19)
insert into [EmpSalary] values('OPS','Emp2',33)
insert into [EmpSalary] values('OPS','Emp3',89)
insert into [EmpSalary] values('OPS','Emp4',89)
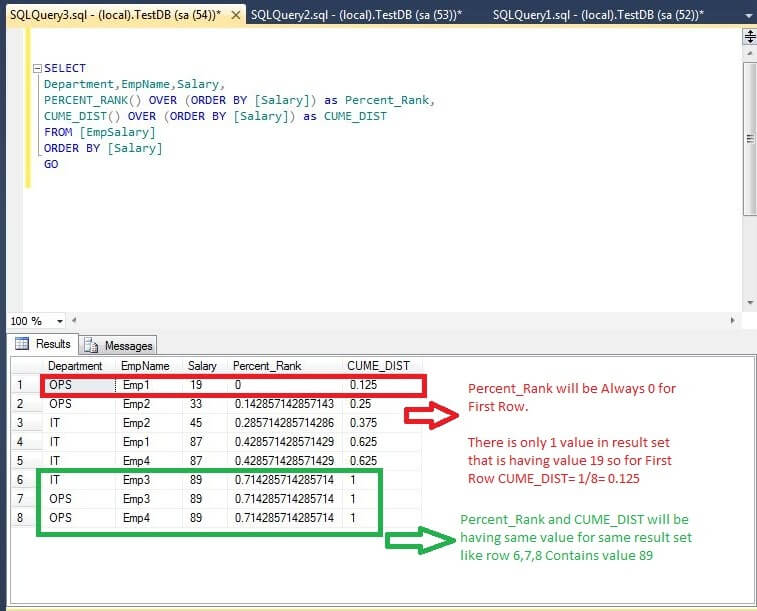
The command for CUME_DIST and PERCENT_RANK is:
SELECT
Department,EmpName,Salary,
PERCENT_RANK() OVER (ORDER BY [Salary]) as Percent_Rank,
CUME_DIST() OVER (ORDER BY [Salary]) as CUME_DIST
FROM [EmpSalary]
ORDER BY [Salary]
GO

CUME_DIST Explanation
The above example uses the CUME_DIST function to compute the salary percentile for each employee. The value returned by the CUME_DIST function represents the percent of employees that have a salary less than or equal to all employees.
Let me explain how we can calculate the values.
- We have a total of 8 records in the table and there are 5 distinct salary values, so CUME_DIST values are determined as follows
- For row 1 there is 1 row with that value or lower, so CUME_DIST = 1/8 or 0.125
- For row 2 there are 2 rows with that value or lower, so CUME_DIST = 2/8 or 0.25
- For row 3 there are 3 rows with that value or lower, so CUME_DIST = 3/8 or 0.375
- For rows 4 and 5 there are 5 rows with that value or lower, so CUME_DIST = 5/8 or 0.625
- For rows 6, 7 and 8 there are 8 rows with that value or lower, so CUME_DIST = 8/8 or 1
PRECENT_RANK Explanation
The above example uses the PERCENT_RANK function to compute the salary percentile for each employee. The value returned by the PERCENT_RANK function represents the percentile rank for that employee compared to all other employees.
For PERCENT_RANK, the first value always has a percent rank of 0 and the rest of the values are divided by their percentage through the number of rows - 1. Since there are 8 rows, and the first PERCENT_RANK starts at 0, the others (8-1=7) are divided equally, so each row has a PERCENT_RANK of 1/7 = 0.1428571428571429. The values are then based on that value times the number of rows that have a value less than the group value.
- For row 1, based on the above, = 0
- For row 2, the value will be (1/7) * 1 (row) = 0.1428571428571429
- For row 3, the value will be (1/7) * 2 (rows) = 0.2857142857142857
- For rows 4 and 5 the value will be (1/7) * 3 (rows) = 0.4285714285714287
- For rows 6, 7 and 8 the value will be (1/7) * 5 (rows) = 0.7142857142857143
Using PARTITON BY for Further Grouping
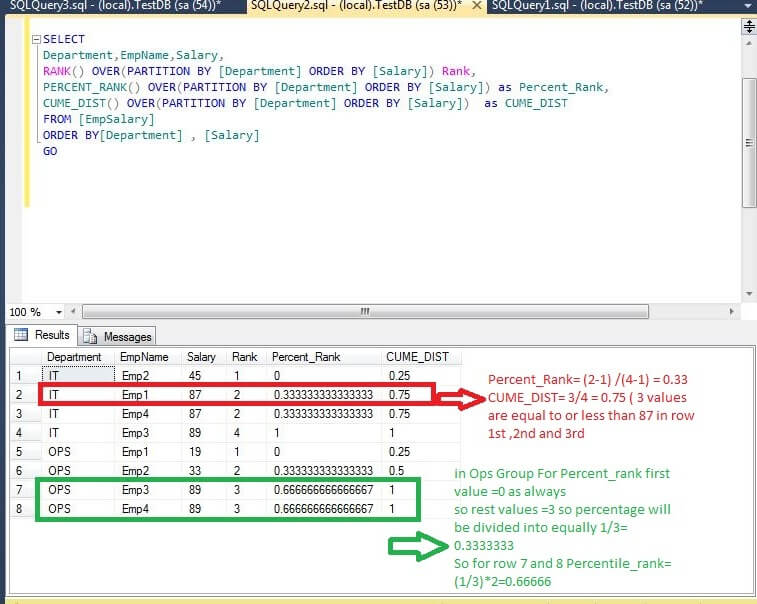
Now if we use PARTITION BY with the OVER clause which divides the result set into smaller groups based on a specified column the query would like this:
SELECT
Department,EmpName,Salary,
RANK() OVER(PARTITION BY [Department] ORDER BY [Salary]) Rank,  --explained later
PERCENT_RANK() OVER(PARTITION BY [Department] ORDER BY [Salary]) as Percent_Rank,
CUME_DIST() OVER(PARTITION BY [Department] ORDER BY [Salary])  as CUME_DIST
FROM [EmpSalary]
ORDER BY[Department] , [Salary]
GO
Output will be as shown:

As we can see the results are divided into two groups based on the partition column Department (IT and OPS).
Let me explain PERCENT_RANK with this formula.
PERCENT_RANK() = (RANK() - 1) / (Total no of Rows - 1)
The rank function returns the rank of each row within the partition of the result set.
Refer to this tip RANK Function in SQL Server for more details.
Let me explain how we can calculate the values.
- For Department (IT) there are a total of 4 rows
- For row 1, CUME_DIST = 1/4 or .25 ( 1 value is less or equal to the value in the first row which is 45 ) and the PERCENT_RANK = (1-1) / (4-1) = 0
- For row 2, CUME_DIST = 3/4 or .75 ( 3 values are less or equal to value 87) and the PERCENT_RANK = (2-1) / (4-1) = 0.333
- The other values can therefore be calcaluted in a similar manner
Next Steps
- Review more tips on functions
About the author
 Rajendra Gupta is a Consultant DBA with 14+ years of extensive experience in database administration including large critical OLAP, OLTP, Reporting and SharePoint databases.
This author pledges the content of this article is based on professional experience and not AI generated.
View all my tips
Article Last Updated: 2012-06-12


