By: Brady Upton | Updated: 2012-11-05 | Comments (1) | Related: > SharePoint
Problem
In a previous tip I explained how to insert SQL Server data into a Sharepoint list using a SSIS package. This tip will focus on creating a KPI in SharePoint to display to your end users.
Solution
A KPI (Key Performance Indicator) is a graphical representation that displays progress against a predefined measure or business goal. KPIs make it easier for end users to evaluate the amount of progress without reading a bunch of data.
We will use the sample data (see below) I used in the previous tip to create our KPI (this data is static since we imported it into Sharepoint as a separate list, so it will not report real time data)
Let's say, for example, our DBA Manager wants to upgrade all the SQL Servers to at least SQL Server 2008 R2 and wants to know how many SQL Servers are not compliant. This is a good scenario for using a KPI to display this data.

Creating the KPI
In Sharepoint, browse to the page where you want the KPI displayed and go to Site Actions > Create:

Custom Lists > KPI List:

For this example, I'll create a list called SQL Versions KPI:

Once, the KPI list is created you should see a blank list. To add a KPI, click New > Indicator using data in Sharepoint list (you can also use other data sources for KPI's):

First, give the KPI a name:

Next, point the KPI to the URL where you created the list that has the SQL Server data and choose the View that was created:

For value calculation, select one of the following:
- Number of list of items in the view - Count of number of entries in the view selected
- Percentage of list items in the view where - Calculation that compares the value of a content type within a column or up to five columns in the list
- Calculation using all list items in the view - A computation of Total, Average, Minimum, or Maximum of a numerical column in the list
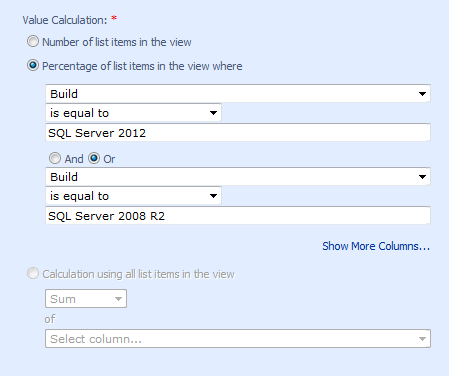
For this example, I want to show the percentage of non-compliant servers, so I'll choose Percentage of list items in the view where...
Also, I want my results to show all SQL Servers that are compliant (SQL Server 2008 R2 or above), so I'll add the following into the where dropdowns:

Status Icons determine which icon to be used to represent the status of the indicator. For this example, my DBA manager wants 100% of my servers upgraded, so I'll select 100 for my green indicator meaning that my goal has been met. I'll choose 60% for my midpoint and everything else will be red. Note: some values will be better higher or lower depending on what you are measuring.
Additional Options
Two other options that are available are:
Details Link
Select the custom page that contains detailed information about this indicator. If no custom page is selected a default details page will be displayed when a user clicks on the indicator in the status indicator list web part.
Update Rules
Recalculate the indicator value for every viewer or manually update the value of this indicator with the Update Values link on the status indicator or on the status indicator list web part.
Viewing the KPI
After creating the KPI, you can see that 25% (3 out of 12) are SQL Server 2008 R2 or above indicating the red status symbol.

Next Steps
- Review these related tips:
About the author
 Brady Upton is a Database Administrator and SharePoint superstar in Nashville, TN.
This author pledges the content of this article is based on professional experience and not AI generated.
View all my tips
Article Last Updated: 2012-11-05


