By: Dallas Snider | Updated: 2013-01-08 | Comments (9) | Related: > Analysis Services Measure Groups
Problem
When creating pie charts using data from Analysis Services, having the MDX query calculate and return the percentages along with the counts or sums is extremely efficient. In this tip, we walk through an example of how this can be done.
Solution
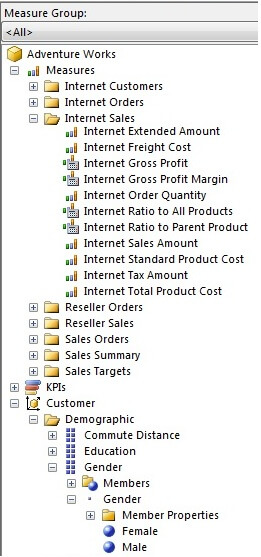
The solution presented in this tutorial will utilize a calculated member using the WITH keyword to perform the percentage calculation. In the code sample provided below, we will get the percentage distribution and sum of the measure Internet Sales-Sales Amount sliced by the Gender attribute of the Customer dimension. The following screenshot shows the aforementioned measure and dimensional attributes as they appear in Query Designer.

In the following code sample we define the name of our calculated member to be [Measures].[Percentage] in line 2. Next in lines 3 and 4 we define the MDX division operation to calculate the percentage. In line 5, the number format is defined to return 4 digits to the right of the decimal point. In line 8, we select the calculated member measure [Measures].[Percentage] and the existing measure [Measures].[Internet Sales Amount]. Line 9 of the sample code selects all of the values in the Customer dimension's Gender attribute.
WITH
   MEMBER [Measures].[Percentage] AS
   [Measures].[Internet Sales Amount]/
   ([Customer].[Gender].currentmember.parent,[Measures].[Internet Sales Amount]),
   FORMAT_STRING = '0.0000'
SELECT
NON EMPTY {[Measures].[Percentage], [Measures].[Internet Sales Amount] } ON COLUMNS,
NON EMPTY {([Customer].[Gender].[Gender].ALLMEMBERS ) } ON ROWS
FROM [Adventure Works]
Please note that it might be intuitive to want to switch lines 3 and 4 so the seemingly higher value (the total sales) is in the denominator after the forward slash (/) and the smaller value (the amount per gender) is in the numerator before the forward slash.
The results from the sample query above as they appear in SQL Server Management Studio are shown below. This result set allows for the use of one query in Reporting Services to provide the percentages needed for a pie chart and the actual values that could be placed in a corresponding table.

Next Steps
- After crafting and testing the MDX query in SQL Server Management Studio, copy and paste the MDX query into the Query Designer text editor window in Visual Studio or Report Builder while designing the report.
- Please refer to the following tip for further assistance with calculated members in MDX: Building Calculated Members for a SSRS Report using MDX.
About the author
 Dr. Dallas Snider is an Assistant Professor in the Computer Science Department at the University of West Florida and has 18+ years of SQL experience.
This author pledges the content of this article is based on professional experience and not AI generated.
View all my tips
Article Last Updated: 2013-01-08


