By: Koen Verbeeck | Updated: 2014-08-05 | Comments (11) | Related: > SQL Server Management Studio
Problem
In the session "Enough Business Intelligence, time for Administration Intelligence" at the ITPROceed event in Belgium, Dr. Nico Jacobs (blog | twitter) introduced the term Administration Intelligence: using business intelligence tools to give administrators – such as DBAs – more insight into their own environment. A quote:
"…using Business Intelligence solutions for analyzing log files, generate documentation, do disk quota estimations and other typical administration tasks."
A very useful tool for getting information about SQL Server are the reports inside SQL Server Management Studio (SSMS). In this tip, we will explore how you can create your own reports and add them to SSMS.
Solution
SQL Server Management Studio Standard Reports
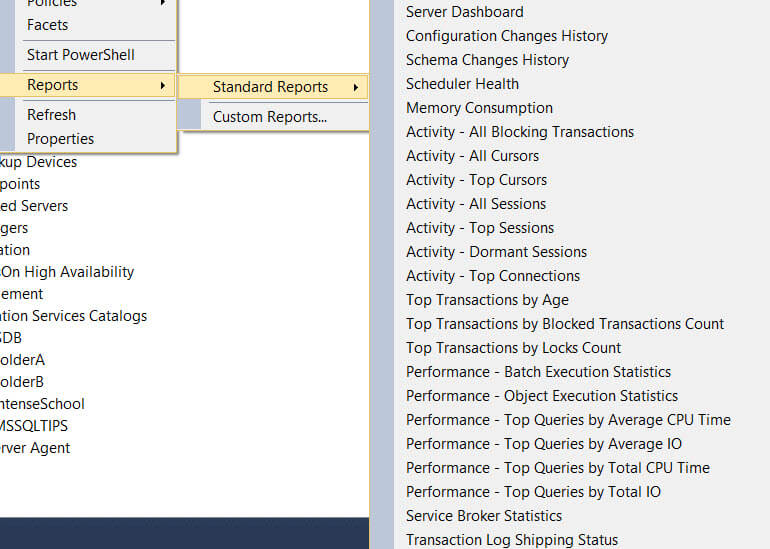
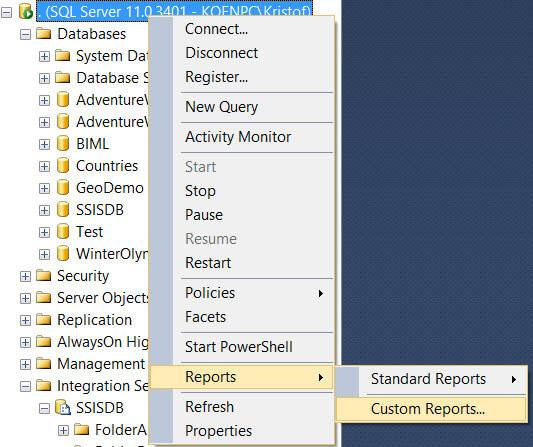
Management Studio already provides a whole array of excellent reports that provide you with crucial information about the server. You can find them by right-clicking on an object and by navigating to Reports/Standard Reports. In the following screenshot you can see an example of the standard reports available at the instance level:
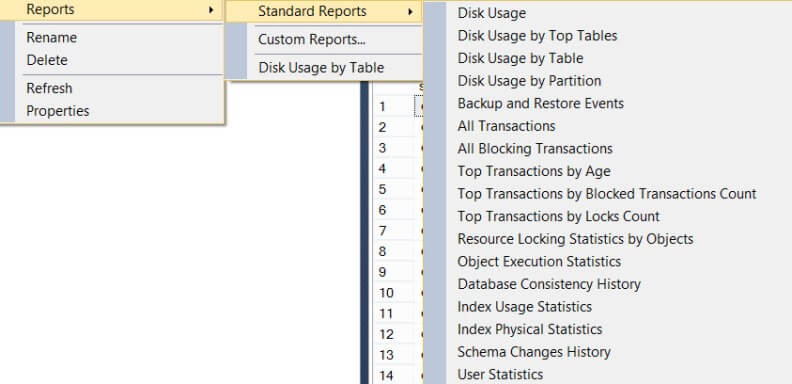
Different objects in SSMS can offer different reports. For example, at the database level we find a different set of reports:
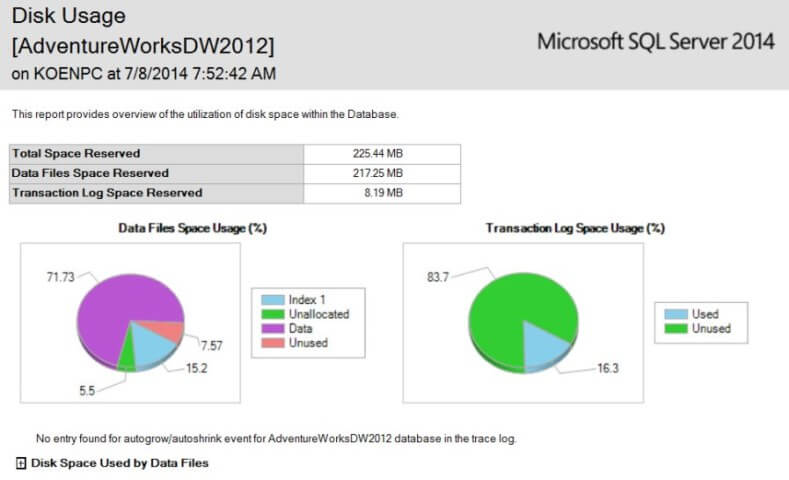
Clicking on a report will open it up right inside Management Studio (ignore the ugly 3D pie charts for now).
Custom Reports in SQL Server Management Studio
Despite the large amounts of reports already available, you still might find the need to report on something that is not yet covered by the standard reports. This can be done by adding your own custom reports to SSMS, which is what this tip is all about.
Creating the Report for SSMS with Reporting Services
First we have to create an SSRS report in SSDT-BI (or BIDS depending on your version of Visual Studio). We will create a report similar to the Disk Usage by Table report found on the database level, but we’ll add some extra information.
The following query retrieves the necessary information from the system views:
WITH cte_tablestats AS
(
 SELECT
   object_id
  ,[rows]   = SUM(CASE WHEN (index_id < 2) THEN row_count ELSE 0 END) -- index_id 0 = heap, 1 = clustered index
  ,[reserved]  = SUM(reserved_page_count)
  ,[data]   = SUM(CASE WHEN (index_id < 2)
         THEN (in_row_data_page_count + lob_used_page_count + row_overflow_used_page_count)
         ELSE (lob_used_page_count + row_overflow_used_page_count)
         END)
  ,[used]   = SUM(used_page_count)
 FROM sys.dm_db_partition_stats -- returns page and row count information for partitions
 GROUP BY object_id
)
, cte_internal AS -- numbers for XML and full text indexes
(
 SELECT
   it.parent_id
  ,[reserved]  = SUM(ps.reserved_page_count)
  ,[used]   = SUM(ps.used_page_count)
 FROM sys.dm_db_partition_stats ps
 INNER JOIN sys.internal_tables it ON (it.object_id = ps.object_id)
 WHERE it.internal_type IN (202,204) -- 202 = xml_index_nodes, 204 = fulltext_catalog_map
 GROUP BY it.parent_id
)
, cte_heaps AS
(
 SELECT object_id, [IsHeap] = 1 FROM sys.dm_db_partition_stats
 WHERE index_id = 0
)
, cte_spacecalc AS
(
-- sizes are retrieved in number of pages, so they should be multiplied by 8 to get the number of kilobytes
SELECT
  [schemaname] = a3.name
 ,[tablename] = a2.name
 ,[row_count] = a1.[rows]
 ,[reserved]  = (a1.reserved + ISNULL(a4.reserved,0)) * 8
 ,[data]   = a1.data * 8
 -- index = total pages used - pages used for actual data storage
 ,[index_size] = (CASE WHEN (a1.used + ISNULL(a4.used,0)) > a1.data
        THEN (a1.used + ISNULL(a4.used,0)) - a1.data
        ELSE 0
        END) * 8
 -- unused = pages reserved - total pages used
 ,[unused]  = (CASE WHEN (a1.reserved + ISNULL(a4.reserved,0)) > a1.used
        THEN (a1.reserved + ISNULL(a4.reserved,0)) - a1.used
        ELSE 0
        END) * 8
 ,[IsHeap]  = ISNULL([IsHeap],0)
FROM  cte_tablestats a1
LEFT JOIN cte_internal a4 ON a4.parent_id = a1.object_id
INNER JOIN sys.all_objects a2 ON a1.object_id = a2.object_id -- retrieve table name
INNER JOIN sys.schemas  a3 ON a2.schema_id = a3.schema_id -- retrieve schema name
LEFT JOIN cte_heaps  h ON a1.object_id = h.object_id
WHERE a2.[type] <> N'S'
 AND a2.[type] <> N'IT'
)
SELECT
  [schemaname]
 ,[tablename]
 ,[row_count]
 ,[reserved]
 ,[data]
 ,[index_size]
 ,[unused]
 ,[IsHeap]
 ,[PercentageOfTotal] = CONVERT(NUMERIC(15,2),
         [reserved] / (SELECT totalReserved = CONVERT(NUMERIC(15,2),SUM([reserved])) FROM cte_spacecalc)
          )
FROM cte_spacecalc
ORDER BY [reserved] DESC;
This query returns the following fields:
- Schema name of the table
- Table name
- Row count
- Reserved: the number of kilobytes occupied by the whole table (data + indexes + unused)
- Data: the number of kilobytes of data inside pages
- Index Size: the number of kilobytes occupied by indexes
- Unused: the number of kilobytes reserved, but not used by the table
- IsHeap: indicator if the table is a heap or not
- PercentageOfTotal: the number of kilobytes reserved for the current table divided by the number of kilobytes reserved by all tables in the database
The results of the query is sorted from the biggest table (in reserved KB) to the smallest. The following report is built upon these fields using SSRS:
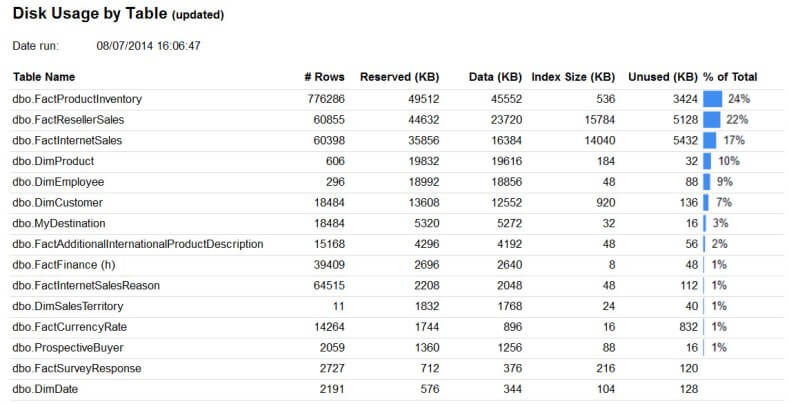
It consists of a simple table displaying all of the key metrics. The percentage of total is visualized using data bars (see also Getting Started with Data Bars in SQL Server 2008 R2 Reporting Services). If a table is a heap, it is indicated with (h) after the table name. An extra indicator is added before the table name if the index size is bigger than 50% of the total table size, as shown below.

The report itself can be downloaded here if you want to take a closer look at how everything is implemented.
Adding the Report to SSMS
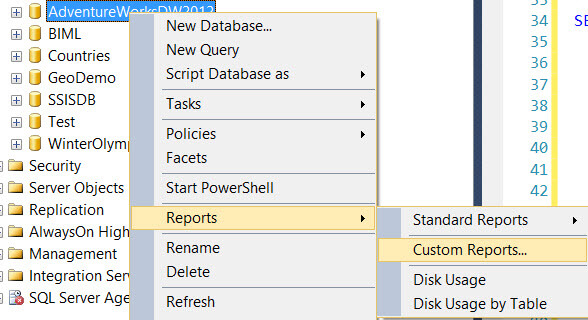
The next step, adding our newly created report to Management Studio, is straight forward. Right-click on a database and navigate to Reports/Custom Reports… in the context menu.
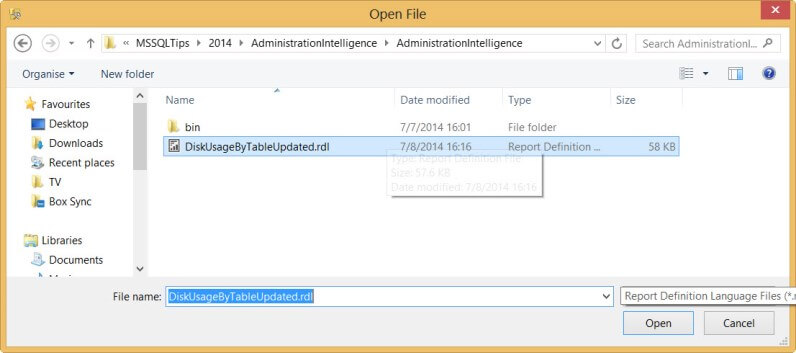
In the pop-up dialog, select the .rdl file of the report created in the previous section.
SSMS will add the report and immediately run it. However, you will get a warning first:
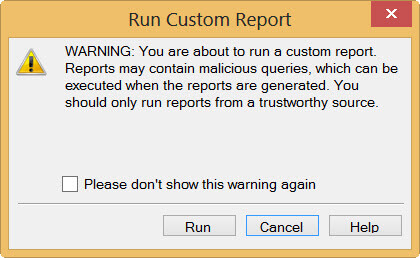
Click on Run. The report is now displayed inside SSMS.

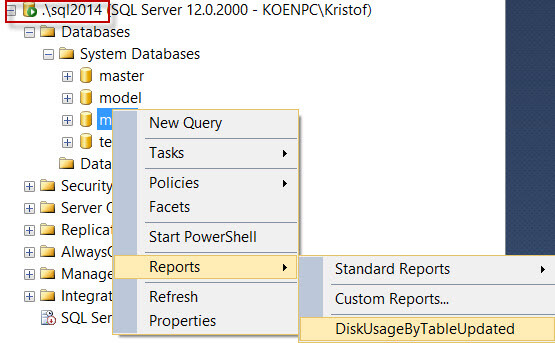
When you right-click again on a database, the custom report is now added to the context menu.
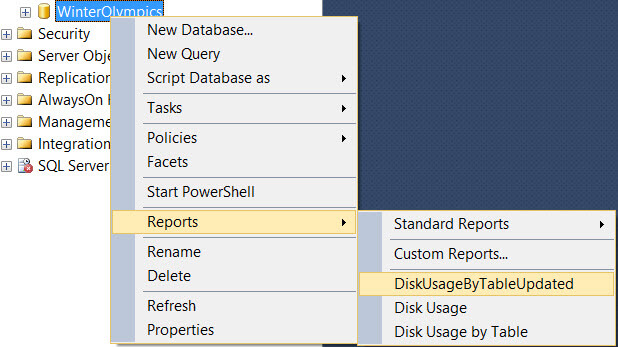
Since we added the custom report at the database level, it is only visible on that object level. The report will for example not be shown at the server instance level.
The report can be run against every database at the server. Management Studio will automatically update the connection string to point the query against the correct database.

What’s even better is that you can connect to another instance of SQL Server and the report will still be there. SSMS will not only change the database name in the connection of the report, but also the server instance.
Limitations with SSMS Reports
It’s not all rainbows and unicorns however, there are some limitations to using custom reports in Management Studio:
- There is no way to execute the reports automatically. This is done to prevent the execution of malicious code.
- A custom report cannot be added to the list of standard reports.
- Subreports cannot be used.
- Only text queries and stored procedures can be used.
- Expressions on the query are not allowed.
- The report runs under the permissions of the user. If the user doesn’t have the necessary privileges, the report can return an error.
For more information, check out Custom Reports in Management Studio on MSDN.
Parameters for SSMS Reports
An important aspect of custom reports in SSMS is that the object explorer passes several predefined parameters to the report at runtime. This allows us to create more dynamic reports or to display more relevant information to the user. Some of the more important parameters are ServerName, DatabaseName, ObjectTypeName (such as database, login, function, …) and ObjectName.
More information can be found in the article How to create Custom Reports for SQL Server Management Studio.
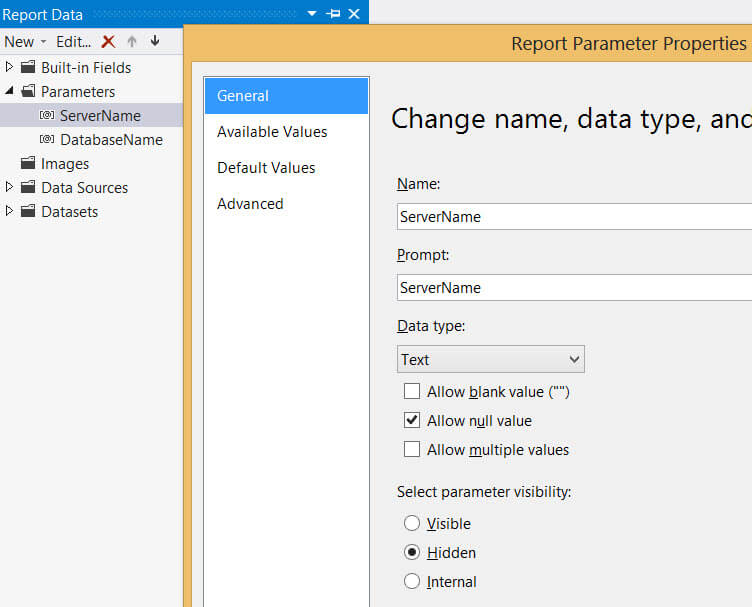
Let’s illustrate with an example. In the report created in the previous sections, two parameters with the names ServerName and DatabaseName are added. There are no available or default values specified, they are marked as hidden and can accept NULL values.
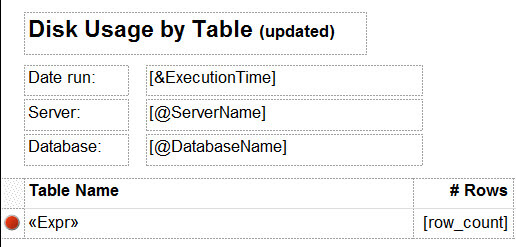
On the report canvas, textboxes are included that will show the values of the two parameters to the report user.
When the custom report is run in SSMS, the parameter values are passed nicely from the object explorer to the report:

Next Steps
- The report created in this tip can be downloaded here for your own use.
- Keep your eye on the site for more tips about administration intelligence and custom reports that you can add to your toolbox.
- More resources on custom reports:
About the author
 Koen Verbeeck is a seasoned business intelligence consultant at AE. He has over a decade of experience with the Microsoft Data Platform in numerous industries. He holds several certifications and is a prolific writer contributing content about SSIS, ADF, SSAS, SSRS, MDS, Power BI, Snowflake and Azure services. He has spoken at PASS, SQLBits, dataMinds Connect and delivers webinars on MSSQLTips.com. Koen has been awarded the Microsoft MVP data platform award for many years.
This author pledges the content of this article is based on professional experience and not AI generated.
View all my tips
Article Last Updated: 2014-08-05


