By: Rahul Mehta | Updated: 2011-01-20 | Comments | Related: > Sharepoint Design
Problem
Certain departments of an organization (like the sales department) have frequently changing targets or goals. For instance, in a sales department a sales representative can have different sales target/goals for each week. Effectively the performance measurement can vary each week. Consider a scenario where the performance measurement threshold values needs to be changed frequently by the business management without depending on IT staff to configure the KPI. In such cases, the KPI threshold values needs to be kept configurable.
Solution
In scenarios like one mentioned above, we would prefer to use a SharePoint KPI List which retrieves threshold values from an external source. For the current situation, we will use an Excel sheet to store the threshold values. We have a sample Excel sheet which holds some threshold values which is (1) the sales goal value of a product, (2) the indicator (actual) sales value and (3) a warning value for sales of a product.
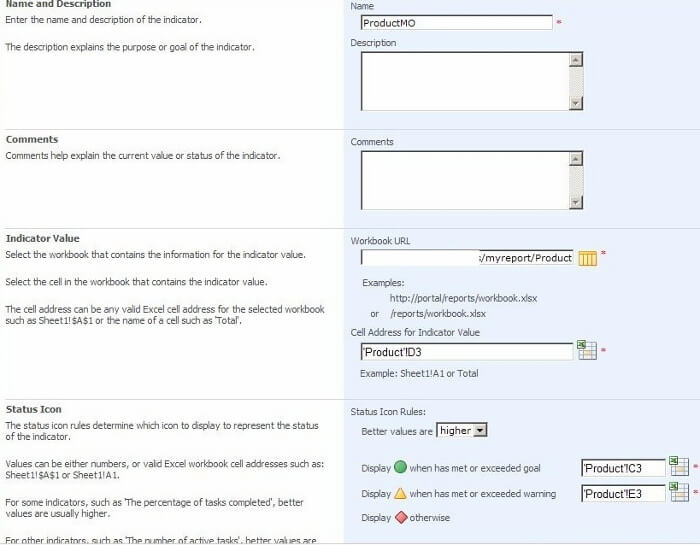
Now let us create a KPI from an Excel sheet. Goto KPI List->New and select "Indicator using data in Excel workbook".
A page will appear where we are supposed to enter some important information like Name of the KPI, the Excel Workbook URL location from where we would select the threshold values (Goal, Indicator and Warning values). As we are taking our threshold values from Excel sheet, we need to either select an Excel workbook cell (like A1, B1 and so on) or manually enter a number. In our case, we have selected relative cell values from an Excel sheet.

After entering the information, press OK and you will see a KPI created in a KPI List with an indicator showing status in Green, Yellow or Red. In our case, we have kept a goal of 1000 where our actual/indicator value is 670, thus results in a red light or rather say below warning level.

Our scenario is to change the threshold values without configuring the KPI. So let us change, the threshold values in the Excel sheet by replacing actual/indicator value to 870.
Go back to list and check the KPI and you will be able to see the Status change from red to yellow showing it is in the warning level range.

We can respectively change the goal and warning values too from within the Excel sheet as we did with the indicator value.
Next Steps
- UUse a KPI List with Excel workbooks to measure different data without changing the KPI in SharePoint
- Use an Excel sheet to change the goal/actual/warning level values to reflect real time data.
About the author
 Rahul Mehta is a Project Architect/Lead working at Tata Consultancy Services focusing on ECM.
This author pledges the content of this article is based on professional experience and not AI generated.
View all my tips
Article Last Updated: 2011-01-20


