By: Rahul Mehta | Updated: 2011-03-23 | Comments | Related: > SharePoint
Problem
In the IT architecture of many enterprises, data resides in different kinds of database management systems like Oracle, SQL Server and others. What if there is a business need to display data in charts in SharePoint from external data sources.
Solution
The SharePoint 2010 Chart Web Part facilitates a connection to external sources using the business data catalog via external content types. This is like a bridge to the external data source.
In this article, we will show you how to display or create a chart using the business data catalog feature. We will be creating a chart which will display different product sales combined on yearly basis.
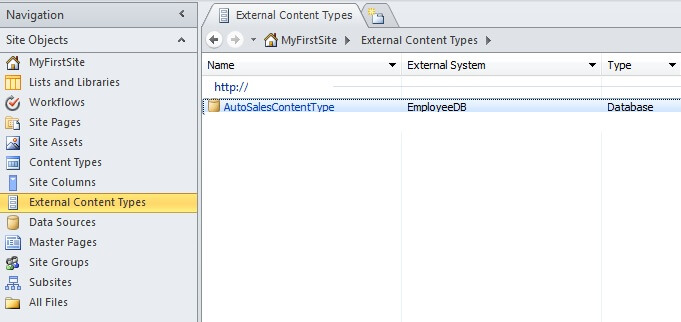
To begin with we create an external content type using SharePoint Designer 2010 which connects to a SQL database which has sample sales data of different products.
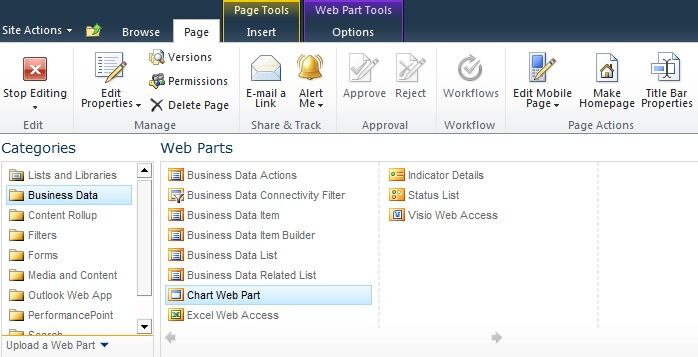
Now go to a site page and click Site Actions -> Edit Page -> Add Web Part. A window will pop up with several categorized options of web parts. Select Business Data -> Chart Web Part.
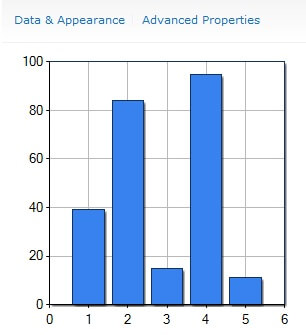
After selecting it, click Add. A sample chart will appear. Click on Data & Appearance to choose the Excel data source.
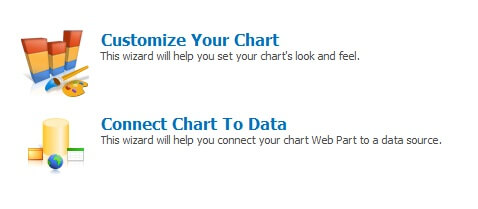
Two options will be displayed: To customize the chart appearance or to choose the data source. For now click, "Connect Chart to Data".
There are four steps one needs to complete to configure the data source.
First, (for our purpose), select "Connect to Business Data Catalog". Click Next.
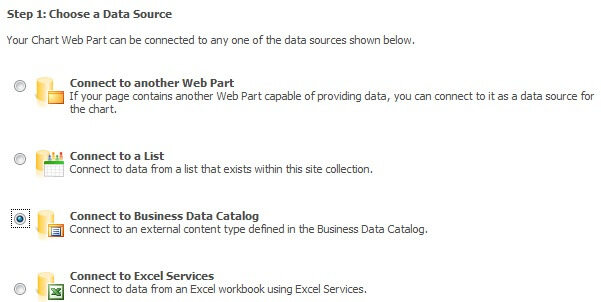
Next, we need to choose the external content type which is a bridge to external data source. We can use the external content type picker to select an appropriate content type. After selecting, click next.

In the next step, we could view data and put on filter parameters for a specific field if we want. For now, just click Next.

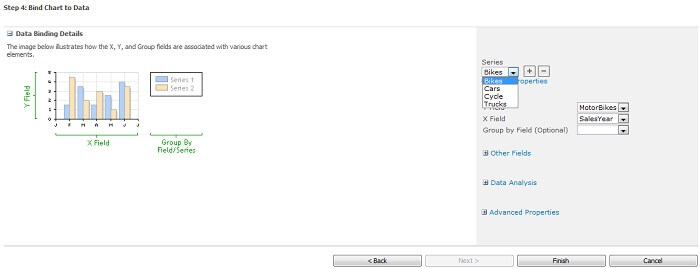
For our purpose, we have defined four types (series) of a products (i.e. Bikes, Cars, Cycles and Trucks) which will show respective sales in different years. For our purpose, always keep "SalesYear" in the "X Field". In all series and the respective series fields like the bike series, keep "Bikes" in "Y Field". Click Finish after the work is done.
After some appearance changes, it looks like the image below.
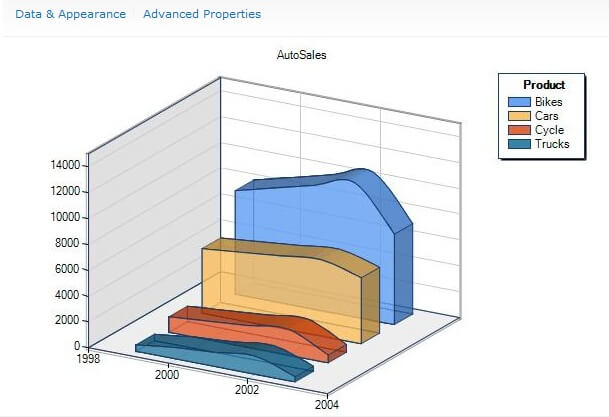
Anyone could use this approach to display data from external data source using business data catalog in chart using SharePoint 2010 out of the box Chart Web Part.
Next Steps
- Use the Chart Web Part to display data from Excel
- Use the Chart Web Part to display data from a SharePoint List.
- Use the Chart Web Part to display data from other web parts on the same page using web part connections.
- Learn how to create external content type using SharePoint Designer 2010.
- Use the Chart Web Part to display 2D and 3D charts.
About the author
 Rahul Mehta is a Project Architect/Lead working at Tata Consultancy Services focusing on ECM.
This author pledges the content of this article is based on professional experience and not AI generated.
View all my tips
Article Last Updated: 2011-03-23


