By: Rahul Mehta | Updated: 2011-03-24 | Comments (1) | Related: > SharePoint
Problem
Enterprise management always prefers to see the progress of the enterprise via reports. Management most of the time prefers to view reports in a graphical (chart) format.
Solution
SharePoint 2010 has been much improved compared to previous versions for providing enterprise data in graphical format/charts. It has a lot more options and a dedicated business intelligence center for processing enterprise data.
In this article we will be exploring one of the options, which is the "Chart Web Part" that facilitates the displaying of data in a chart format. The Chart Web part supports its input data from web parts, SharePoint Lists, Business data catalogs (external data sources like Oracle and others) and Microsoft Excel.
In this article, we will show you how to display or create a chart using Excel data. We will be creating a chart which will display different product sales, combined on yearly basis.
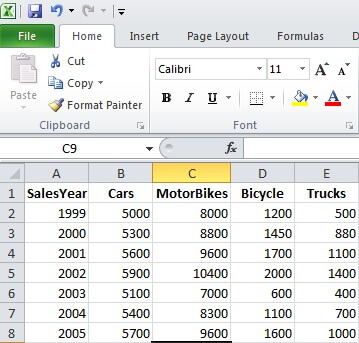
To begin, we create an Excel document which has sample sales data of different products and upload it to a SharePoint library.
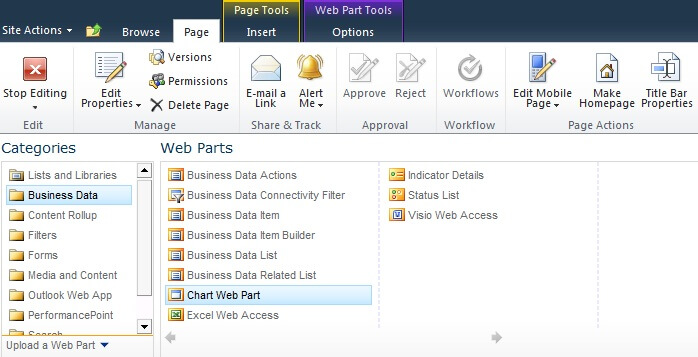
Go to a site page and click Site Actions -> Edit Page -> Add Web Part. A window will pop up with several categorized options of web parts. Select Business Data -> Chart Web Part.
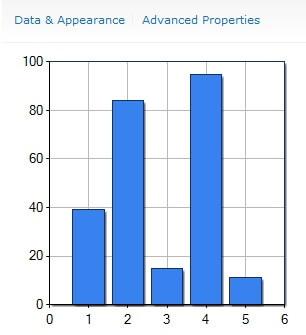
Select it and click "Add". Then you will see a chart appear displaying a sample data chart. Click on "Data & Appearance" to choose the Excel data source.
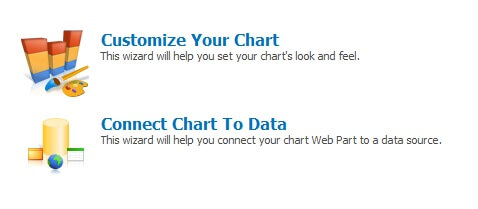
You will be prompted with two options: To customize the chart appearance or choose the data source. For now, click "Connect Chart to Data".
First, select "Connect to Excel Services". Click Next.
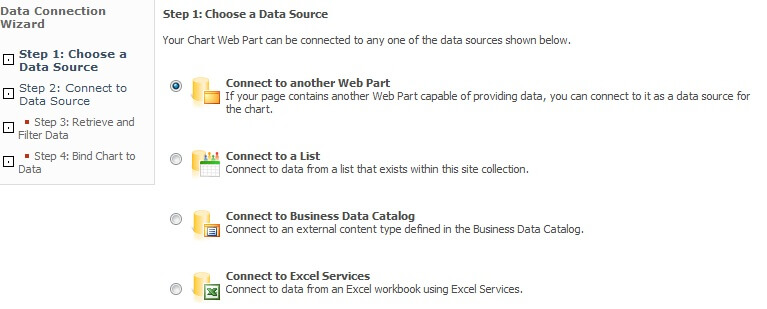
Next we need to fill four details.
1) The Excel web service URL which is relative to the web application and most of the time prepopulated. So don't change the URL
2) The path of the stored Excel workbook in the web application.
3) Range of the data in the Excel sheet. In our case it is from cell A1 through E8 (shown in the image below).
4) Choose whether our data contains headers/column names or not.
After putting all together, click Next.

Next, we can view some data and put on filter parameters for a specific field, if desired. For now, click Next.

And finally, we bind the data to the chart. For that we need to define different series that represents different data on chart. In each series, we again define what would go on the X and Y axis. There are a couple of more options to explore like defining other fields, operations included in data analysis and configuring advance properties.
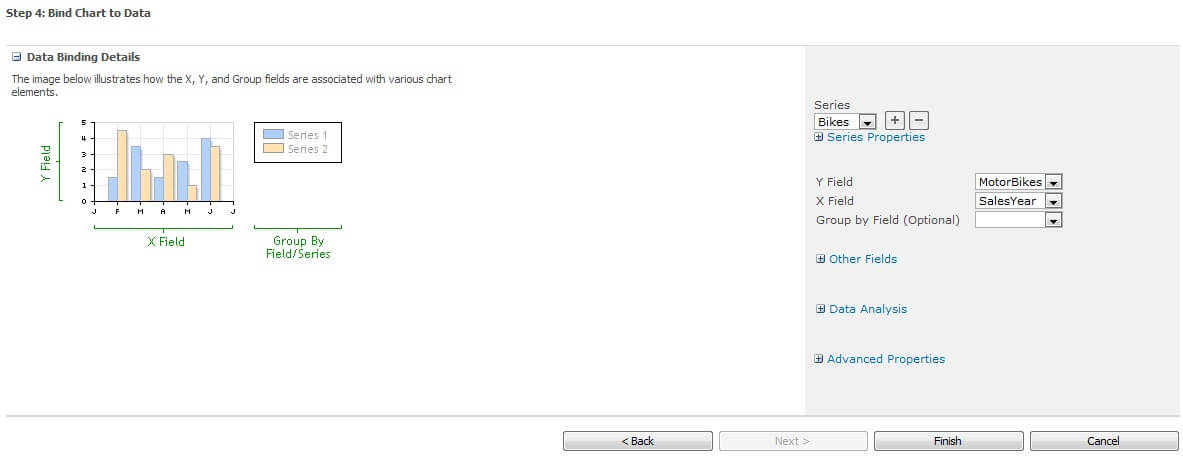
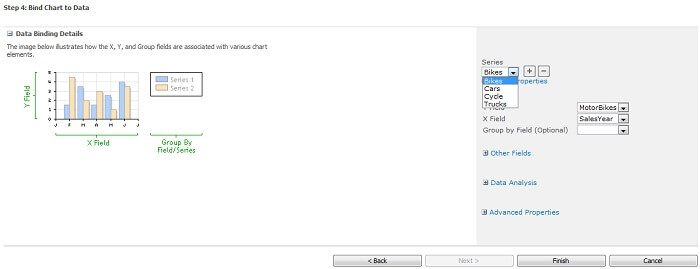
For our purpose, we have defined four (data) series of a product (i.e. Bikes, Cars, Cycles and Trucks) which shows the respective sales in different years. For our purpose, always keep "SalesYear" in the "X Field". In all data series and respective series fields, like the bike series, keep "Bikes" in the "Y Field". Click Finish after the work is done.
We have made some appearance changes to chart (which could be done from Data & Appearance -> Customize Your Chart) and it looks like the image below.
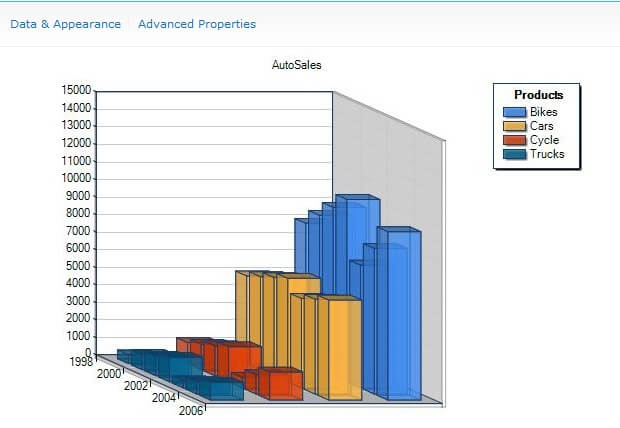
So one could use this approach to display data from Excel in a chart using the SharePoint 2010 out of the box Chart Web Part.
Next Steps
- Use the Chart Web Part to display data from external data source like Oracle and other external sources.
- Use the Chart Web Part to display data from a SharePoint List.
- Use the Chart Web Part to display data from other web parts on the same page using web part connections.
- Use the Chart Web Part to display 2D and 3D charts.
About the author
 Rahul Mehta is a Project Architect/Lead working at Tata Consultancy Services focusing on ECM.
This author pledges the content of this article is based on professional experience and not AI generated.
View all my tips
Article Last Updated: 2011-03-24


