By: Arshad Ali | Updated: 2011-05-11 | Comments | Related: > SharePoint Administration
Problem
For diagnostic logging, the Unified Logging Service (ULS) has been available since previous versions of SharePoint. But what improvements and refinements have been done in SharePoint 2010? What are the options available for diagnostic logging in SharePoint 2010? How better we can control the amount of diagnostic information to be logged in SharePoint 2010?
Solution
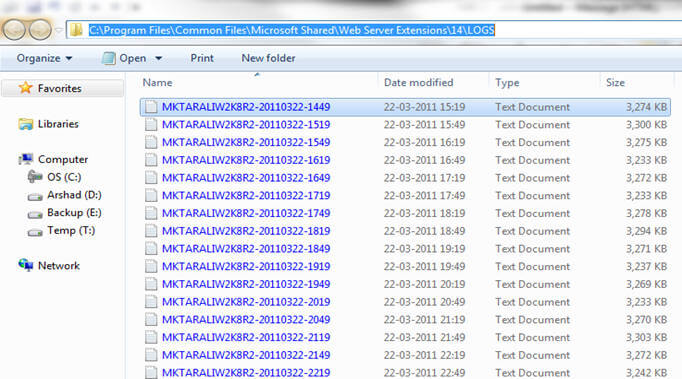
SharePoint 2010 has improved the way the ULS logs information and now these diagnostic logging data can be written to trace files, Windows Event Viewer and a new SharePoint reporting database (new in SharePoint 2010). Trace log files are created in a Log folder under the root folder where SharePoint has been installed by default; that is also called the 14 Hive. In my case, I have a stand alone installation on the C drive and hence path goes like this:
C:\Program Files\Common Files\Microsoft Shared\Web Server Extensions\14\LOGS folder.
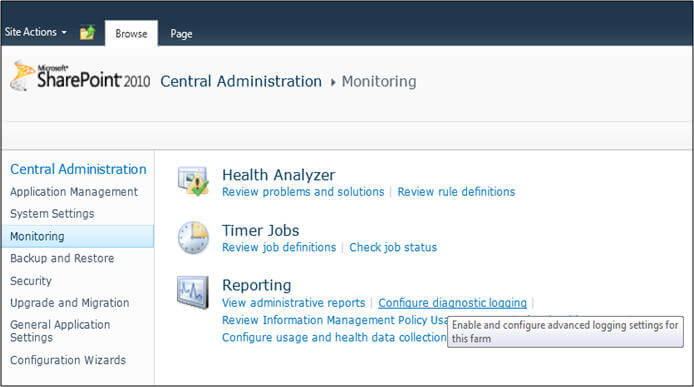
Before digging more into this log folder and file information, lets see how to configure the diagnostic logging. Go to the Monitoring link on the left side of SharePoint 2010 Central Administration and click on "Configure diagnostic logging" under "Reporting" as shown below:
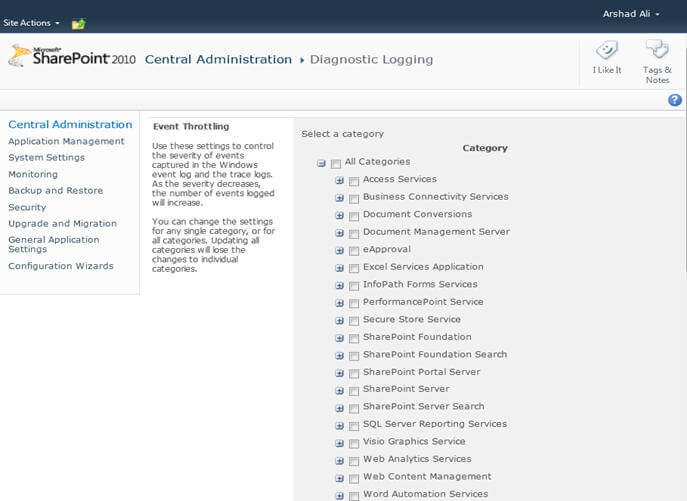
On the diagnostic logging page, you will see several parameters to configure for diagnostic logging. The first one is Event throttling. Here you can see multiple categories and sub categories of events for finer control.
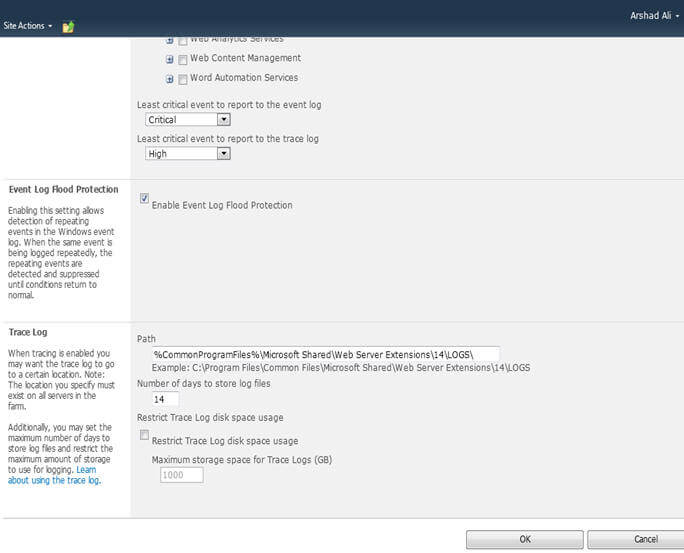
If you scroll down below, you will see two combo boxes "Least critical event to report to event log" and "Least critical event to report to trace log" which you choose after selecting categories and sub categories as above. The first one tells the least critical event which will be logged to the Windows event log; similarly, the second one tells the least critical event which will be logged to trace log. All critical events higher than the 'least' will also be logged. As the severity decreases, the number of events being logged will increase, so be watchful on this.
Event Log Flood Protection is a great feature and you should keep it enabled always unless there is an absolute need of changing it. When you enable it, SharePoint does not log repeating messages again and again. It logs for the first time and then detects and suppresses all the messages until the condition returns back to normal.
Ideally you should set the "Number of days" for the log to be maintained or "restrict the log space" growth or both. If you set both "Number of days" for the log to be maintained and "restrict the log space" growth then whichever comes first will be given preference.
For example, consider you have given 30 days of logs to be maintained and maximum storage space is 100GB. And suppose on the 10th day, 100GB of space has been consumed. Then on the 11th day, the 1st day's log will be removed so as to occupy a maximum of 100GB - only even though you have 30 days setting.
As mentioned before, by default, trace files are created in the log folder of the SharePoint root folder. But now with SharePoint 2010, the best part is that these files are compressed and consume much less space. The naming convention that SharePoint uses for these trace files is "ServerName-YYYYMMDD-HHMM" and each subsequent file is created in 30 minutes intervals by default. This can be changed if needed, as you can see below:
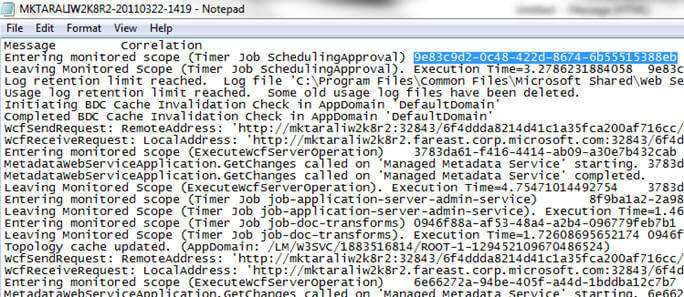
You can use your favorite Notepad tool to open trace files for analysis or you can use any ULS log viewer tool, like this one which shows log information in a more user friendly interface instead of using standard log file viewers. When you open any of these files, you will notice a host of information. Though it may seem confusing, SharePoint 2010 helps you here as well with the Correlation ID.
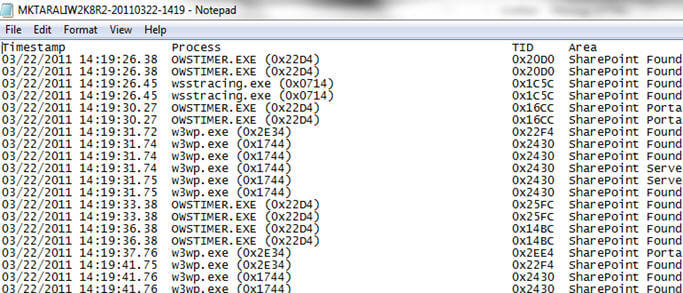
If you look at the image above, finding a specific entry in the log file, especially when you have enabled verbose logging, can be really difficult. SharePoint 2010 comes to the rescue here as well by assigning each log entry a unique GUID value called Correlation Id (also known as the Correlation Token). When there is any error on the page SharePoint 2010 shows this correlation Id on the page, you can take this Correlation Id and search in the log files to find the reason for failure. Now the best part is that the Correlation Id is grouped on the same conversation/session (initiated by a user) on the server and across the servers, which helps you to troubleshoot slow loading of a page.
Best Practices and Notes
- Verbose logging is great for troubleshooting showing a greater level of detail logging, but can slow performance. You should use this option prudently or during troubleshooting only and turn it off immediately once you are done.
- By default information is logged in the Log folder under the root folder where SharePoint has been installed. You should consider changing this location to some other drive (or high speed drive especially in case if you are using verbose logging) than the drive on which SharePoint has been installed. Also make sure that the same location is available on all the servers of the farm.
- Event Log Flood Protection is a great feature and you should keep it enabled always unless there is an absolute need of changing it. When you enable it, SharePoint does not log repeating messages again and again. It logs for the first time and then detects/suppresses all the messages until the condition returns back to normal.
- You can specify the number of days for which logs are to be maintained by SharePoint, oldest files are deleted by SharePoint to maintain those many days log files. If you have some critical logging messages which you want saved, you should consider taking a backup of those files.
- By default, diagnostic logging will keep on growing on the disk. So ideally you should restrict the disk space to be used for logging. When you set a restriction and the log grows beyond that, then the oldest log is removed to make room for new log entries.
- If you set both the "Number of days" for the log to be maintained and "restrict the log space" growth, then whichever comes first will be given preference.
- A developer can write custom messages for diagnostic logging using the SPDiagnosticsService class. You can even control the diagnostic logging behavior programmatically using this class. Please note it does not work in a Sandboxed environment (unless you create full trusted proxy and call it from Sandboxed solutions).
- There is an unsupported ULS log viewer which you can use to view the log in a more user friendly interface instead of using standard log file viewers, click here for more details.
Next Steps
- Review the SPDiagnosticsService class on msdn.
- Review the Configure diagnostic logging article on technet.
- Review Health Analyzer in SharePoint 2010 tip.
About the author
 Arshad Ali is a SQL and BI Developer focusing on Data Warehousing projects for Microsoft.
This author pledges the content of this article is based on professional experience and not AI generated.
View all my tips
Article Last Updated: 2011-05-11


