By: Manoj V | Updated: 2011-06-29 | Comments | Related: > SharePoint
Problem
Creating information dashboards is always a challenge for end users, especially when we need to pull data from various sources. The PerformancePoint Service (PPS) is a Microsoft BI technology for displaying information dashboards within a SharePoint platform. PPS was not part of MOSS 2007. But with SharePoint 2010, Microsoft has added PPS as a service within the Enterprise version of SharePoint 2010. The Dashboard Designer provides a rich authoring environment for creating and managing dashboard content.
Solution
The Dashboard Designer is the Microsoft answer for integrated BI reporting within SharePoint 2010. In this article we will see how to start creating basic reports using the Dashboard Designer. I will walk you through displaying Excel charts using PerformancePoint webparts.
1. To create dashboards and reports we need a BI Center site collection. If it is not present in the SharePoint farm, create a new site collection using the "Business Intelligence Center" template.
The BI Center has the following built-in libraries and lists:
2. Dashboard Designer can be opened from Start > Programs > SharePoint or from the Performance Content library in the BI Center site collection by clicking "Add new Item". It is recommended that you use Internet Explorer to launch Dashboard Designer for the first time and then afterwards, you can launch Dashboard Designer by using the Start menu (Click Start > All Programs > SharePoint > PerformancePoint Dashboard Designer)
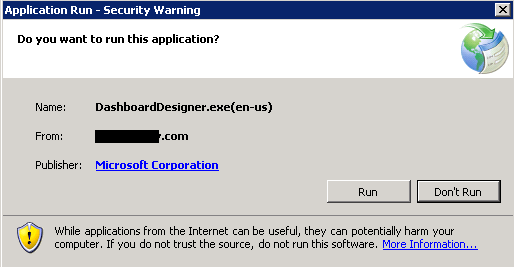
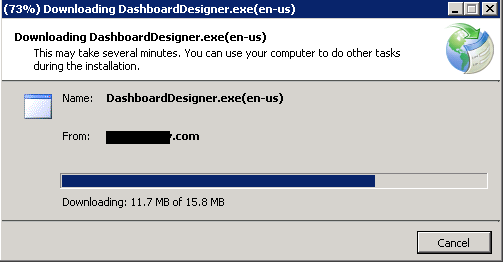
3. This opens the Dashboard Designer which installs on a client computer by using ClickOnce, a Web-based deployment technology.


4. In the Dashboard Designer, right click "PerformancePoint Content" and create a new Dashboard. I'm creating a Dashboard named Dash1.
5. Select an appropriate Page Template and click OK. Then name the Dashboard accordingly from the left panel (called Workspace Browser).
6. The Dashboard is a page where we can display reports, charts, etc. To display an Excel report on this Dashboard we need an Excel Report object. Right click "PerformancePoint Content" - New - Report.
Select the Excel Services template and click OK.
7. Enter details, select Document library, Excel file, and item name. Save the report by clicking the Save icon on the top menu.
8. The next step is to use this Report on the Dashboard page. From the Details pane of the Dashboard Designer drag the report object we created on to a zone in the page.
The Excel Report has been dragged on to the Left Column on the page.
9. Next we have to deploy the Dashboard page to a SharePoint BI site. Right click dashboard - then click Deploy to SharePoint
10. Once the Dashboard is displayed the page opens in browser, here is how the dashboard will be displayed.
Every Dashboard we deploy will be created as a new folder in the library where we choose to deploy. Multiple pages can be created on a folder.
We can create a complete Dashboard site with multiple pages, with reports and charts that pull data from various sources. This would be an ideal place for managers to track status/progress of projects, assets, resources, etc. We can create different dashboards based on the target audience and have separate dashboards for the Sales team, the IT team, and project managers, etc.
The Dashboard Designer is an ideal tool to start creating information dashboards in SharePoint 2010 sites and I would recommend users to try the designer and explore the possibilities.
Issues Faced
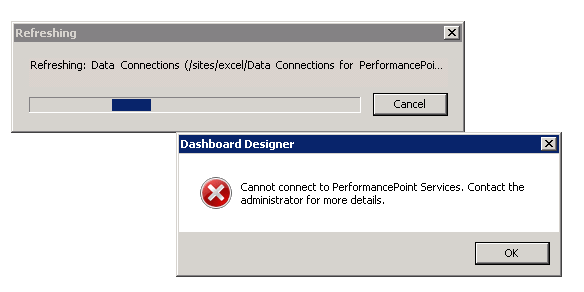
One of the issues I faced was the error "Cannot connect to PerformancePoint Services. Contact the Administrator for more details"

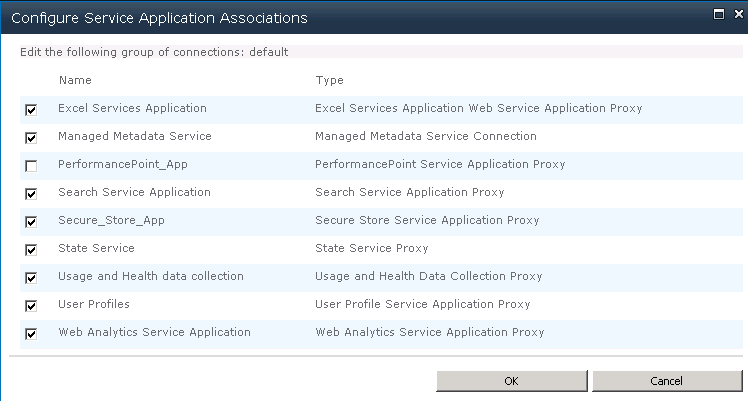
The cause of this error is that the service application was not associated to a default proxy. To enable a default proxy, navigate to "Configure Service application associations" > click application group > check to enable the PerformancePoint Service application you have created.


Next Steps
- How to Configure PerformancePoint Services in SharePoint 2010
- PerformancePoint Dashboard Designer 2010 Help and How-to
- How to Configure PerformancePoint Services in SharePoint 2010
- PerformancePoint Dashboard Designer Faq
- Error: Cannot connect to PerformancePoint Services. Contact the administrator for more details
About the author
 Manoj V
This author pledges the content of this article is based on professional experience and not AI generated.
View all my tips
Article Last Updated: 2011-06-29


