By: John Miner | Updated: 2015-12-03 | Comments | Related: > Power BI
Problem
The Power BI desktop designer is a great tool and in this tip we will look at advanced mathematical formulas using the M language.
Solution
The first step of any Power BI project is to load data into the model. The image below explains the process flow for Power Query, but still applies to the Power BI desktop designer. Today, we will connect to our Excel data source. We will be writing advanced mathematical formulas in the M language. Since we are working with only one dataset, there will be no combining of data. As a result of our actions, the data is available (shared) for reporting.

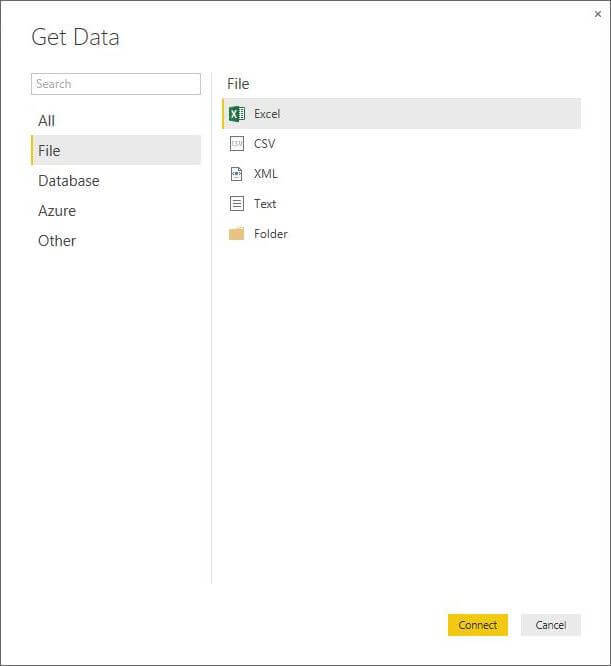
Find the home menu on the Power BI desktop designer. Click the Get Data option on the ribbon. Click more at the bottom of the drop down box of most common selections. Choose the FILE option on the left pane. Last but not least, select MS Excel as the import file type.
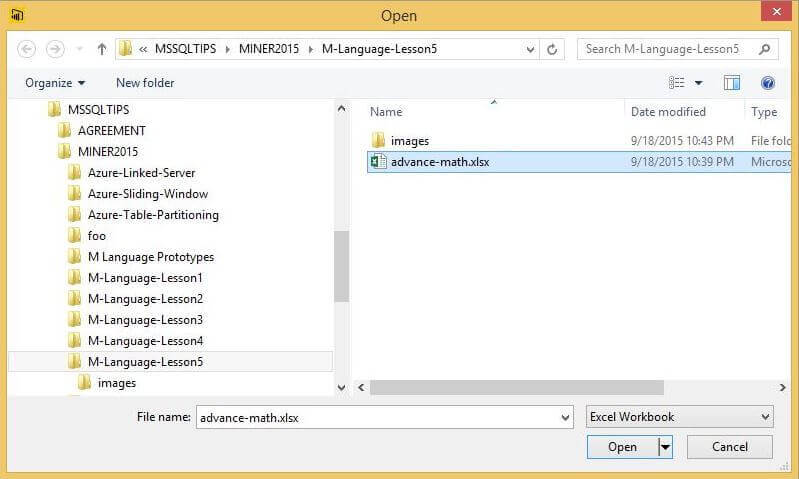
Browse to the location of the "advance-math.xls" file. This is a simple data set that I crafted for this tip. You can download the file from this link.
Clicking the OPEN button loads the data into a preview view window. Select the "Sample Data" worksheet as the source. The user can either LOAD the data without manipulation, EDIT the data or CANCEL the current operation.
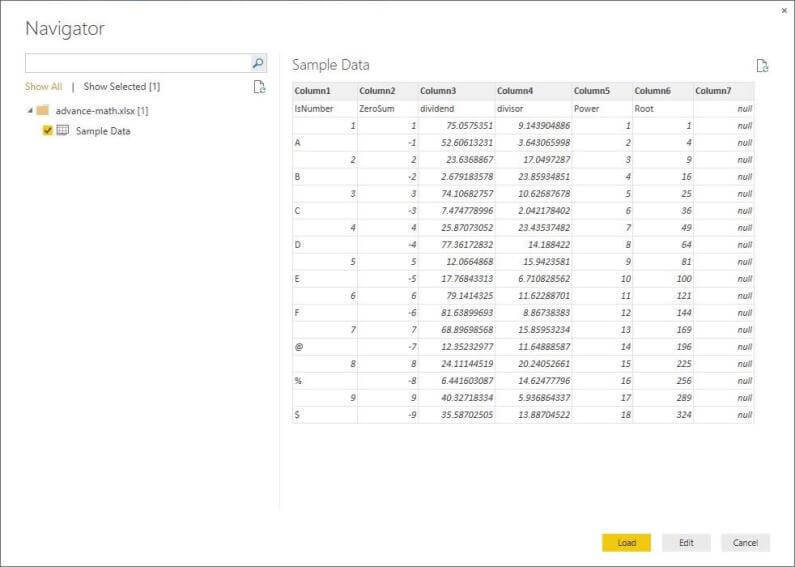
Please choose the EDIT option to manipulate the data using a set of steps in a query.
We can see that the last column needs to be removed from the data set. Also, the first row needs to be promoted as a header. When it is possible, fixing data at the source will reduce the number of query steps. Each step can be equated to some amount of processing on your laptop. Thus, adding to the over time to load the data. In your Sample Data set, I already removed column 7.
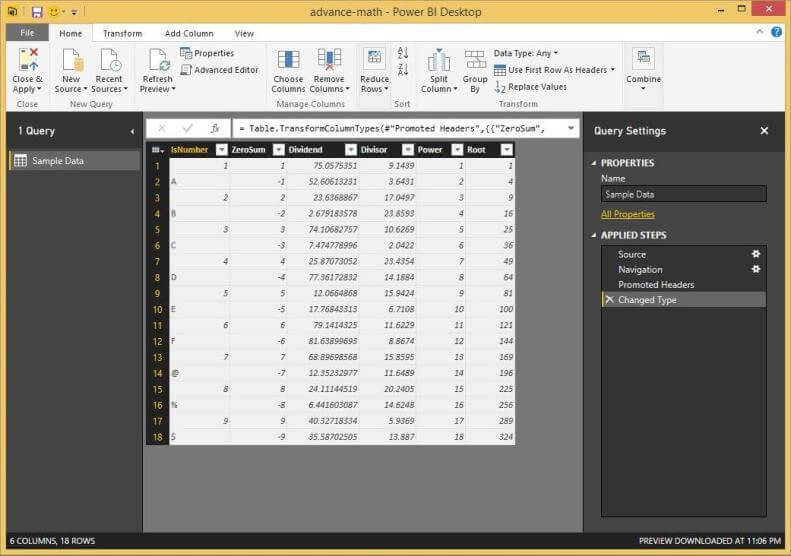
Again, please promote the top most line to a header. Change the data type of the [ZeroSum], [Root] and [Power] columns to integers. Convert the data type of [Dividend] and [Divisor] columns to decimals. This task can be done by right clicking the column and selecting change type action from the menu. Choose the correct type in the sub-menu.
The sample data set contains the following columns: [IsNumber] contains alpha numeric data; [ZeroSum] contains negative, positive, odd and even numbers; [Dividend] & [Divisor] contain real numbers for division; and the [Root] & [Power] contain integer values.
We will be using this data with our advanced mathematical formulas.
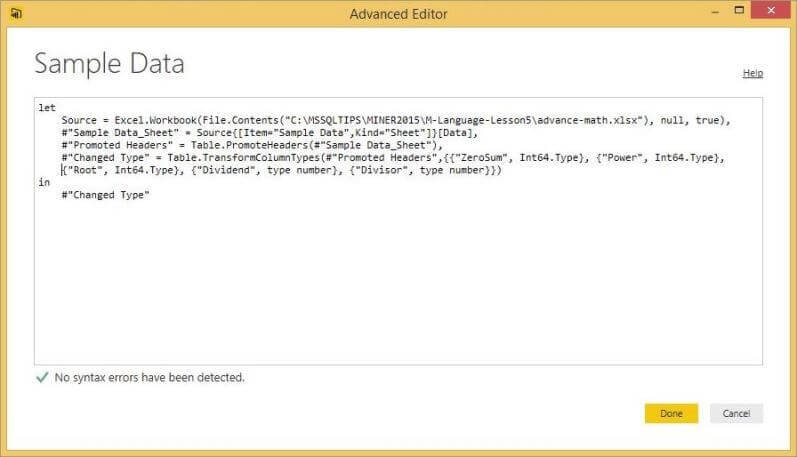
If you followed the instructions correctly, the resulting M language query should look like the one above. The Excel.Workbook function tells the M language the content type of the file. Since there can be multiple worksheet in any MS Excel file, the Source function selects the correct data.
Data Type Conversions in Power BI
Many times, a BI Developer needs to convert from a textual format to a numerical format. How can we accomplish this task?
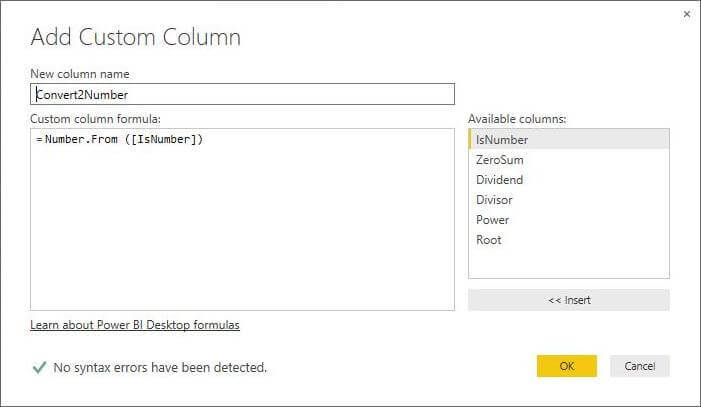
The Number.From function allows for the conversion of a text value to a numeric value.
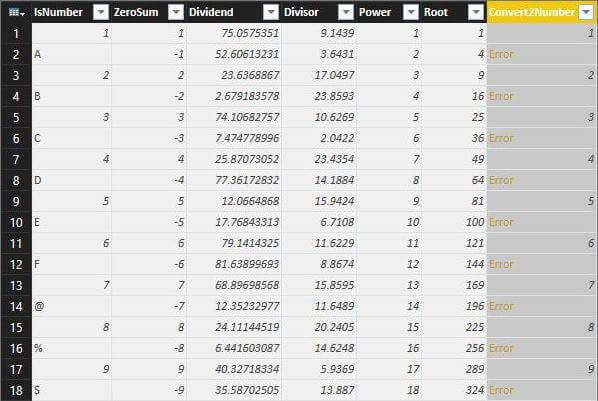
However, the results are just not appealing. Any value that is a number is correctly converted to a number. All null values result in a null value result. Any non-numeric characters in the input results in a error value. In this format, we can not apply any aggregations during reporting.
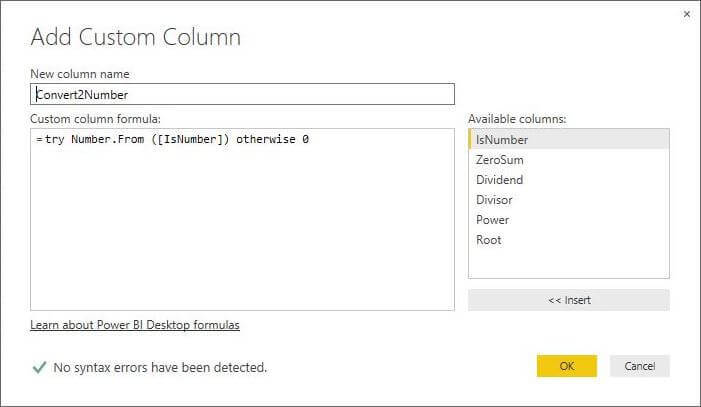
Like most languages, the M language has implemented error handling. Start the computed column with the try clause and catch errors with the otherwise clause. To allow for aggregation, we will convert the data to a number. If there is an error during conversion, we will return a zero value.
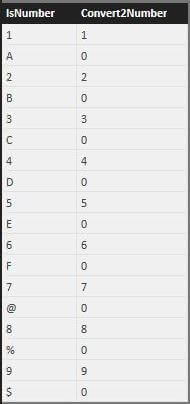
The [Convert2Number] column now contains data that we can report on. I just touched the tip of the iceberg when it comes to these functions.
Numerical Formulas in Power Query Formula Language
The Power Query formula language informally know as "M" supplies the developer with a bunch of functions on information and operations involving numerical data. Let us start looking at the informational functions using the [ZeroSum] column. We will be adding computed columns to our Sample Data set to demonstrate each function.
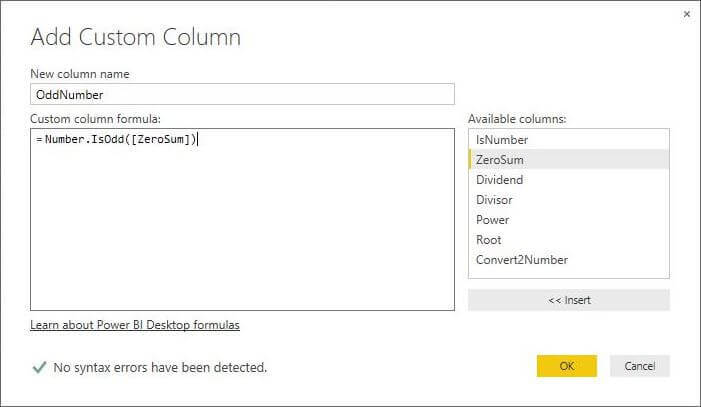
M Language Number.IsOdd Function
We can determine if a number is odd by calling the Number.IsOdd function.
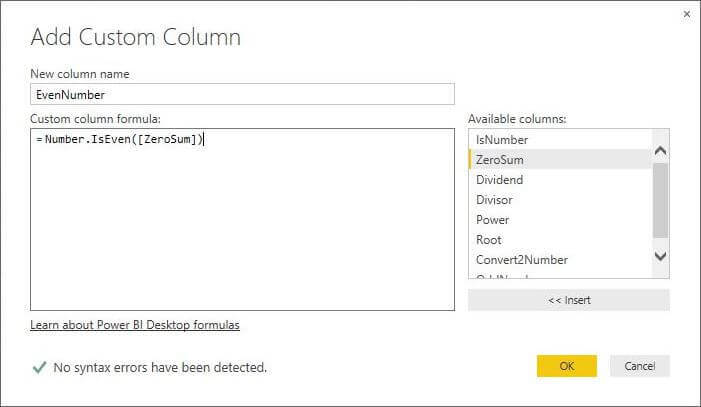
M Language Number.IsEven Function
We can determine if a number is even by calling the Number.IsEven function.
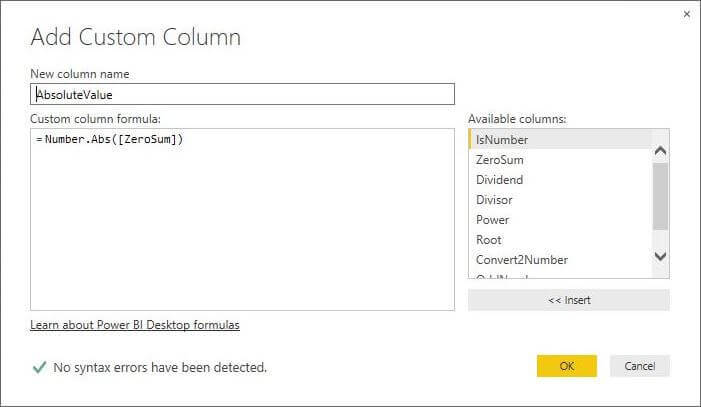
M Language Number.Abs Function
We can determine the magnitude (size) of a number by calling the Number.Abs function.
M Language Number.Sign Function
We can determine the sign a number by calling the Number.Sign function. It returns a value of -1 for negative numbers and 1 for positive numbers.
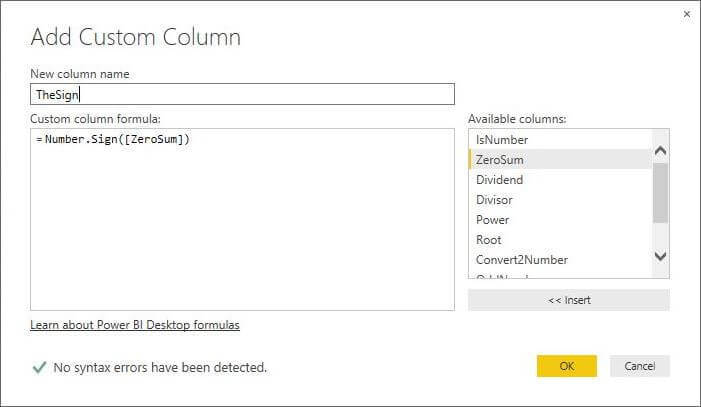
Most of the results seen below are what you expect from the functions.
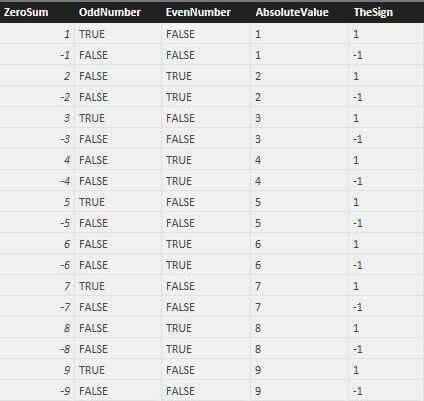
The [OddNumber] column seems to have a odd nature. No pun intended. The function does not work with negative numbers. The definition of a odd number by www.mathisfun.com is "Any integer (not a fraction) that cannot be divided exactly by 2."
I have submitted a bug request to the Microsoft Power BI team. However, how can we work around this bug right now?
The quickest fix to the problem is to re-write the formula as Number.IsOdd(Number.Abs([ZeroSum])). Another solution is to define a function in the M language that tests if the number is an integer and determines if 2 does not evenly divide the number.
Numerical Operations in the M Language
Now, we can concentrate on non-trigonometric, numerical operations supported by the M language. We will be adding computed columns to our Sample Data set to demonstrate each function. Each function can be used to solve a specific mathematical question.
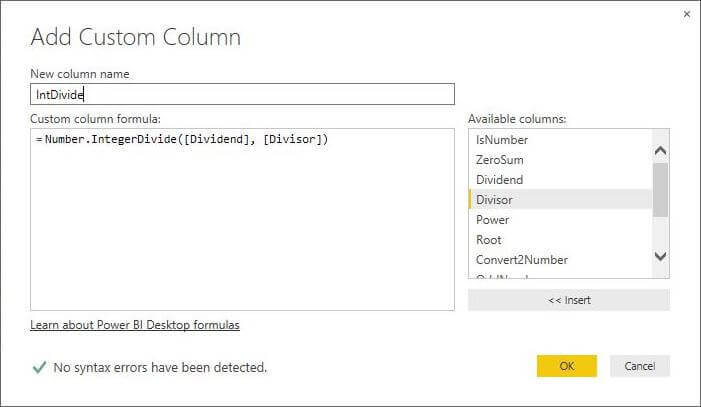
M Language Number.IntegerDivide Function
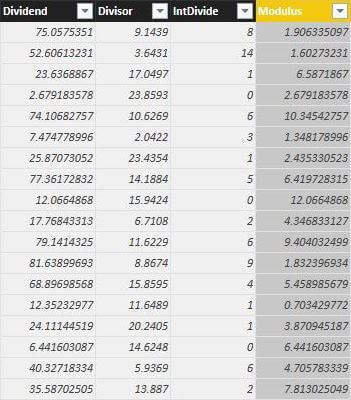
How many times the [Divisor] divides into [Dividend] evenly? This question can be answered by calling the Number.IntegerDivide function.
M Language Number.Mod Function
What is the remainder of the [Dividend] divided by the [Divisor]? The answer to the question can be found by calling the Number.Mod function.
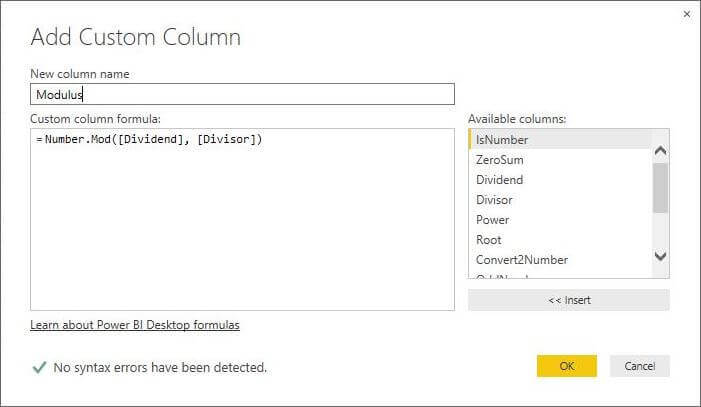
The results below are from a sample use of the Number.IntegerDivide and Number.Mod functions.
M Language Number.Power Function
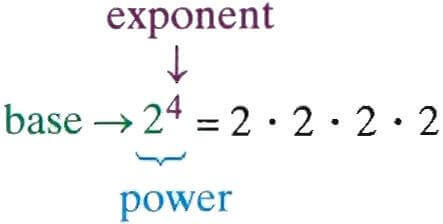
The power (exponent) of a number says how many times to use the number (base) in a multiplication. The image below shows 2 raised to the fourth power.
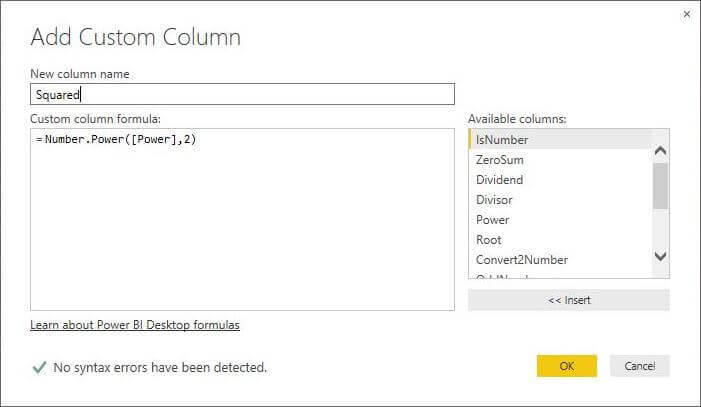
How do we raise a number to the two's power? This is also know as squaring the number. We can use the Number.Power function on the [Power] column to investigate this question.
M Language Number.Sqrt Function
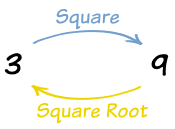
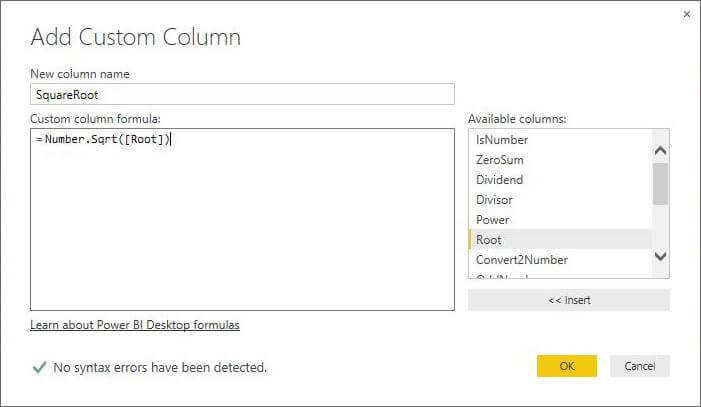
The opposite (inverse) of squaring a number is taking the square root of a number. I am only talking about positive squared results. Otherwise, we will have to talk about i imaginary numbers. In short, every positive square has two roots, a positive one and a negative one. Thus, we can replace 3 with -3 in the image below and have the same balanced equation.
The image below depicts the use of the Number.Sqrt function on the [Root] column. Almost all languages return just the positive square root of any number.
M Language Number.Factorial Function
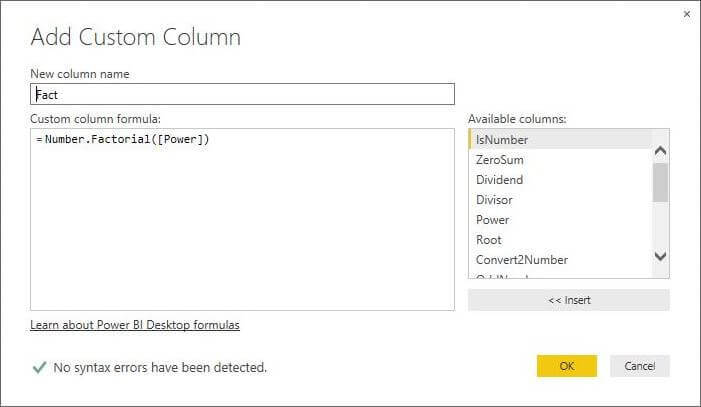
The factorial function, expressed with the ! symbol, is defined as the multiplication of a series of descending natural numbers. Thus, three factorial written as 3! = 3 x 2 x 1 = 6. The image below illustrates the [Power] column expressed as a factorial using the Number.Factorial function.
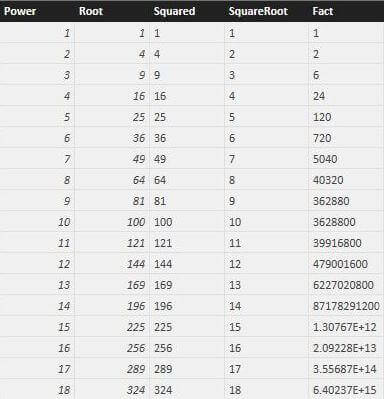
The results below are from a sample calls to the Number.Power, Number.Sqrt, and Number.Factorial functions.
M Language Number.Exp Function
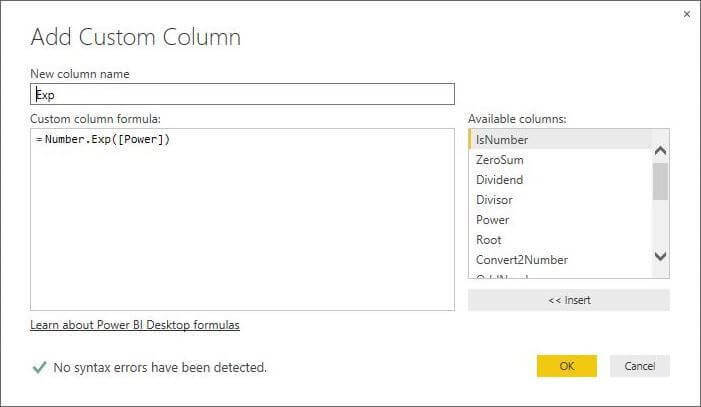
Euler's number, expressed as a lower case e, is an important mathematical constant and is the base of the natural logarithm. It is approximately equal to 2.71828. The exponential function raises e to the power of x. This can be represented mathematically as (e ^ x).
The formula below defines the [Exp] column as the result of calling the Number.Exp function with the [Power] column.
M Language Number.Ln Function
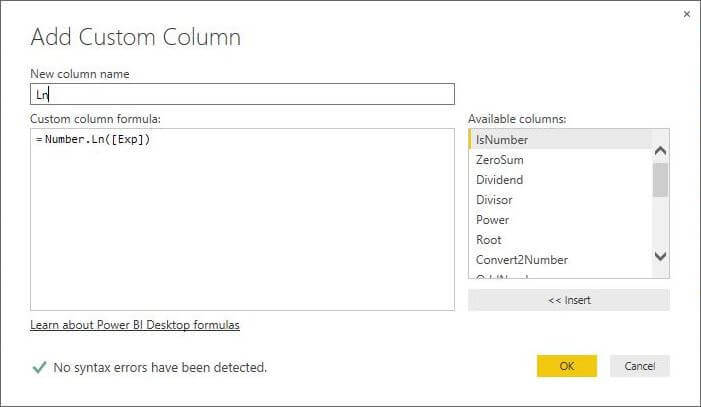
The natural logarithm, expressed as ln, is the inverse function of exp. Therefore, ln (e^x) = x.
The formula below calls the Number.Ln function with the [Exp] column. Because we are applying the inverse, the result equals the original input, the [Power] column.
M Language Number.Log10 Function
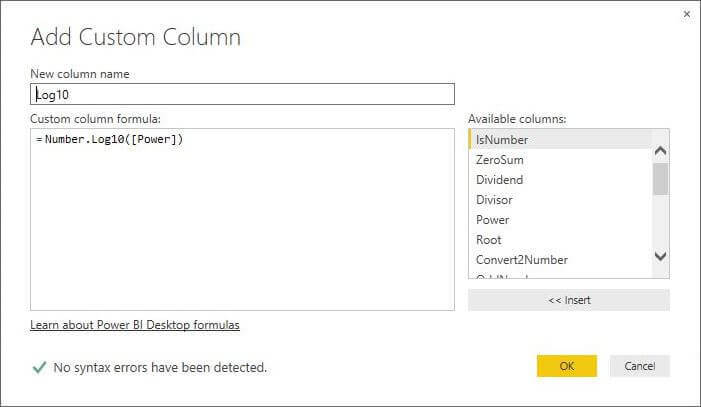
The M language contains the common logarithm. It can be defined 10 raised to the x power equals the number y or 10 ^ x = y. The following equations are true: log10 (1000) = 3, log10 (100) = 2, and log10 (10) = 1.
The formula below defines the [Log10] column as the result of calling the Number.Log10 function with the [Power] column.
M Language Number.Log Function
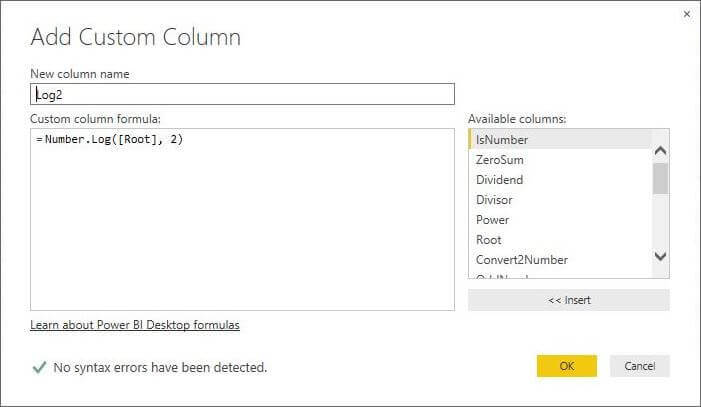
The M language contains the binary logarithm. It can be defined 2 raised to the x power equals the number y or 2 ^ x = y. The following equations are true: log2 (8) = 3, log2 (4) = 2 and log2(2) = 1.
The formula below defines the [Log2] column as the result of calling the Number.Log function with the [Root] column.
M Language Number.Combinations Function
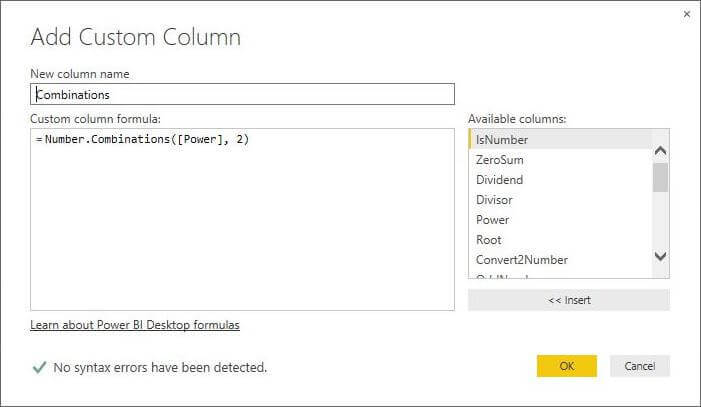
In mathematics, a combination is a way of selecting k items from a total collection of n items. The order of the k items does not matter. However, the answer to this question can be expressed as the equation below. We can finally use that factorial function that was introduced earlier. Thus, how many ways we can select 2 items for a set of 4. This is mathematically equal to 4! / (4-2)! 2! = 6 combinations.

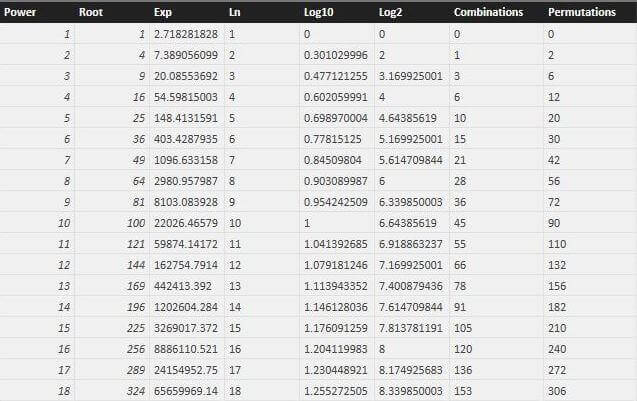
The formula below defines the [Combinations] column as the result of calling the Number.Combinations function with the [Power] column as the set size and 2 as the selection size.
M Language Number.Permutations Function
In mathematics, a permutation is a way of selecting k items from a total collection of n items. The order of the k items does matter! However, the answer to this question can be expressed as the following equation. Again, the factorial function is used in expressing the answer. Thus, how many distinct ways we can select 2 items for a set of 4. This is mathematically equal to 4! / (4-2)! = 12 permutations.

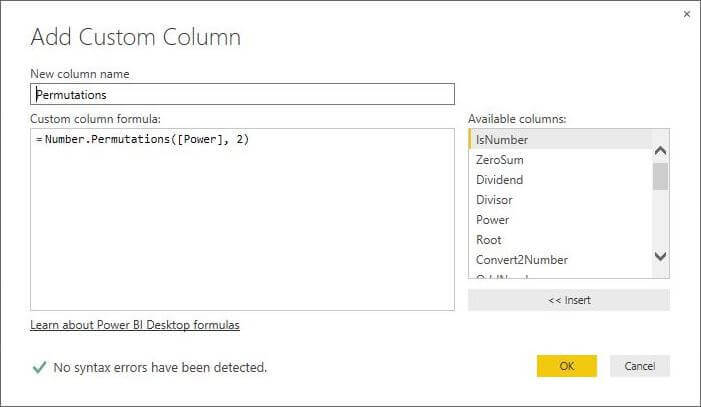
The formula below defines the [Permutations] column as the result of calling the Number.Permutations function with the [Power] column as the set size and 2 as the selection size.
The results below are from a sample calls to the above functions.
Numerical Constants in the M Language
The last topic to cover today is the numerical constants that are supplied by the M Language.
M Language Number.Epsilon Function
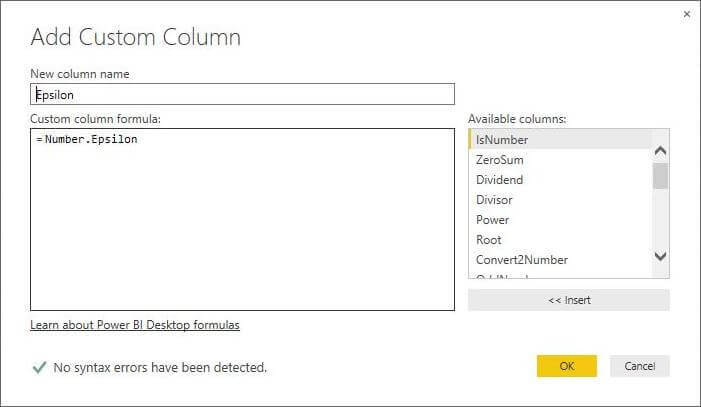
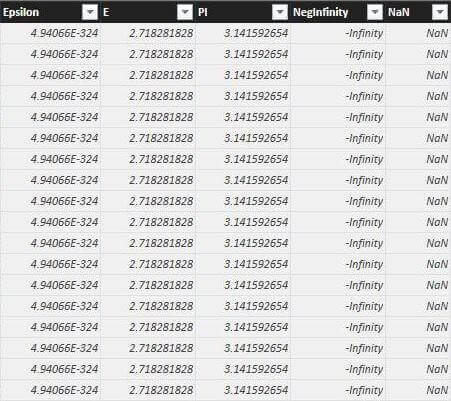
The Number.Epsilon function returns the smallest value in the M language.
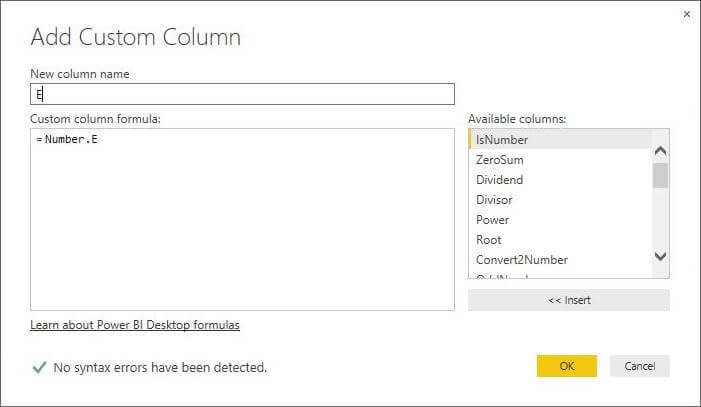
M Language Number.E Function
The Number.E function returns Euler's number.
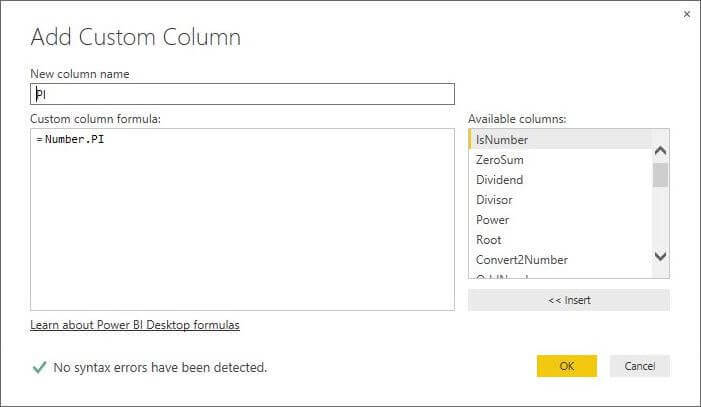
M Language Number.PI Function
The Number.PI function returns the ratio of a circles circumference to the diameter which is depicted by the Greek letter PI in mathematical literature.
M Language Number.PositiveInfinity and Number.NegativeInfinity Functions
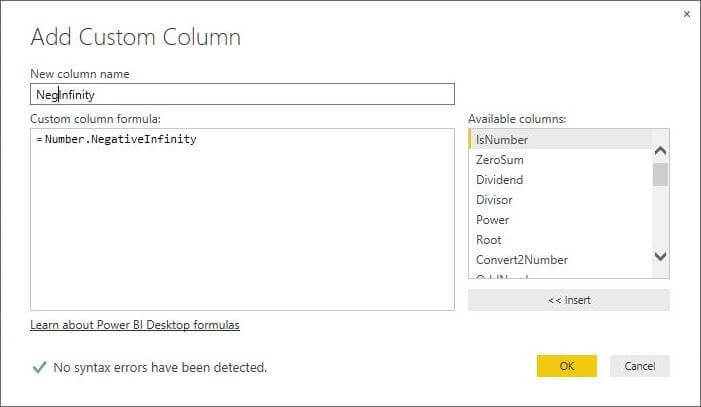
The M language contains both a Number.PositiveInfinity and Number.NegativeInfinity functions. The definition of infinity describes something without limits. For instance, if we take a -1 and continuously divide by 2. This sequence of numbers is infinite in size, approaches zero and never reaches zero.
The image below shows the use of the negative infinity function.
M Language Number.Nan and Number.IsNaN Functions
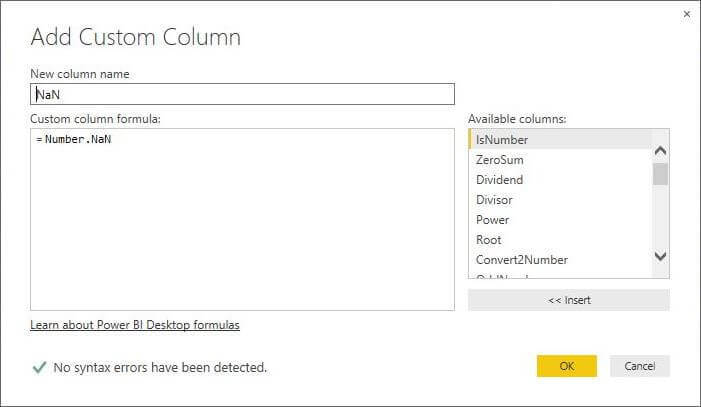
This next function is called Number.Nan which represents 0/0. Beginning programmers who have not coded defensively for division by zero might have been waken up in the night to fix such a bug. In mathematics, division by zero is undefined. The is a informational function Number.IsNaN that returns true if the column contains this value. In short, I just do not see any real use of these functions unless you are study some advanced mathematical structures.
The results below are from a sample calls to the above functions.
Summary
The Power BI desktop designer contains a rich set of advanced mathematical functions. We can combine these functions together in a computed column to solve numerical business problems. Some of these functions are not readably applicable to our day-to-day issues. Having knowledge of these functions is a good foundation to draw upon.
Before I wrap up this tip, I want to talk about one real use of the log10 function called the Logarithmic scale. This technique is used to graph the magnitude of some variable that has a large range of values.
One example that I can think of is the number of retail returns (R) over the course of weeks in a year. I can imagine that the numbers are relatively low for most weeks. However, I am sure there is a big spike during the holiday season. If we graphed this value R on the dashboard, we might have values ranging from 100's of items to thousands of items. On the other hand, if we graph log10 (R) we would have number between 0 an 5. The graph would be cleaner to show the spikes during special times of the year.
Next Steps
- Check out these other M language tips
Learn more about Power BI in this 3 hour training course.
About the author
 John Miner is a Data Architect at Insight Digital Innovation helping corporations solve their business needs with various data platform solutions.
This author pledges the content of this article is based on professional experience and not AI generated.
View all my tips
Article Last Updated: 2015-12-03


