By: Koen Verbeeck | Updated: 2016-01-11 | Comments (3) | Related: > SQL Server 2016
Problem
This tip covers a new Reporting Services 2016 feature: exporting reports to PowerPoint.
Solution
A new feature introduced in the SQL Server 2016 preview CTP 2.4 is the ability to export reports to PowerPoint. To test this functionality, I used the sunburst chart from this tip How to create a Sunburst Graph in SQL Server Reporting Services 2016.
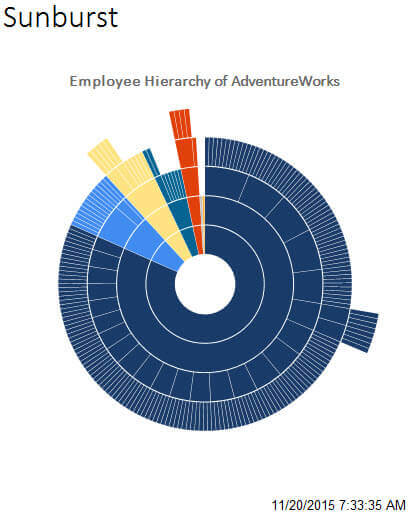
The careful reader may have noticed that in the latest CTP 3.0 release, the sunburst now by default starts with the biggest slice at 12 o'clock. This was one of the remarks in the sunburst tip, but it has already been fixed by the SSRS team.
When the report is run, you can simply select PowerPoint from the export drop down menu.
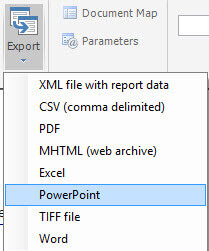
If you don't see PowerPoint listed, you can check the report server configuration file (RSReportServer.config) to see if the PPTX rendering extension is registered and visible. There's a known bug that when you upgrade SQL Server 2016 from an older CTP to CTP 2.4, the PPTX rendering extension is not installed. In that case it's better to install a brand new SSRS instance using CTP 2.4 or later.
When the report is rendered, you'll get a dialog prompting you to save the PowerPoint file. When you open the file, you can see the result:
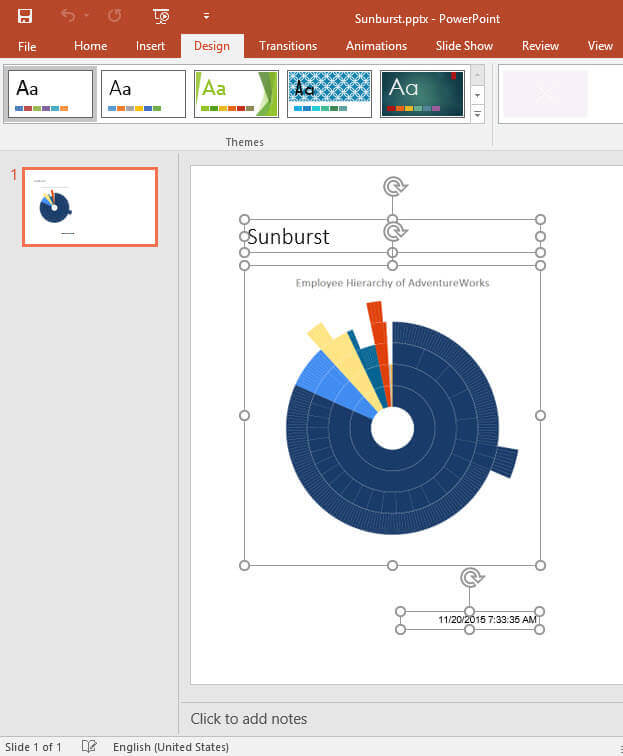
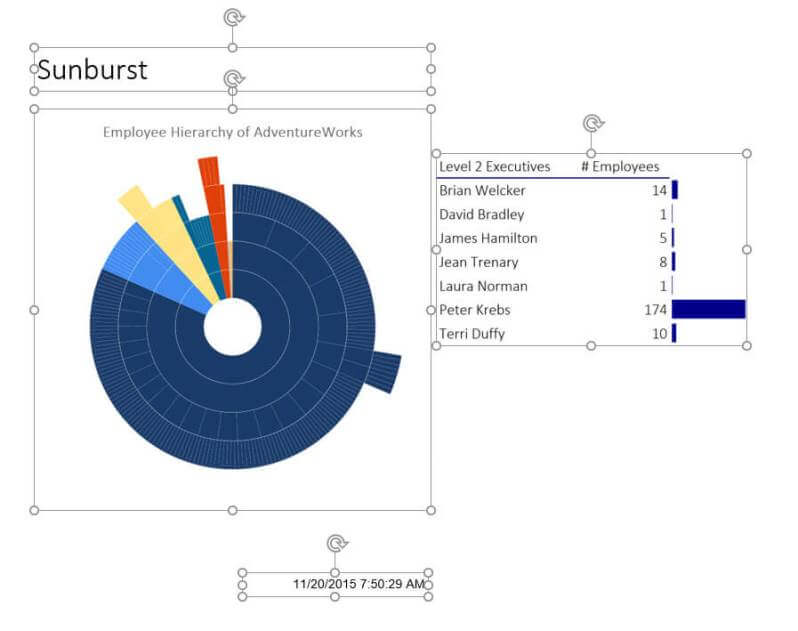
The title and the footer have been translated to separate text boxes and the chart has been converted to an image. Now let's add a table to our report:
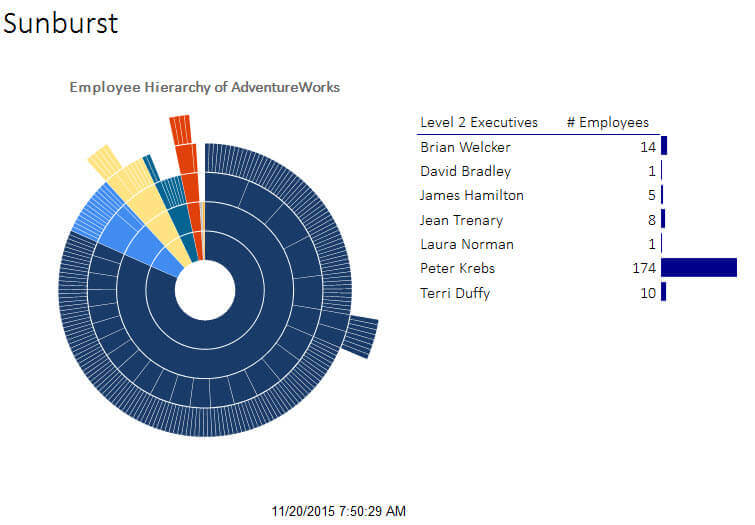
When exported to PowerPoint, the table has been converted to an image as well and not to a PowerPoint table.
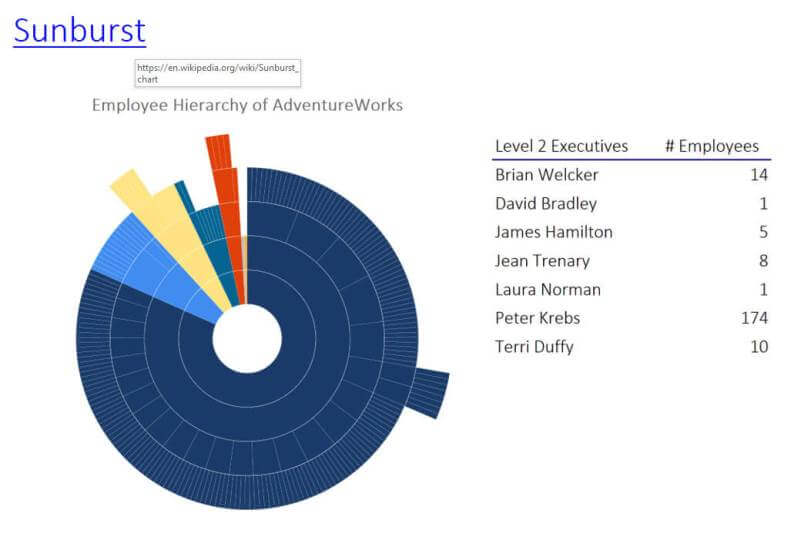
Actions (such as linking to a URL) are preserved on textboxes (like the title for instance), but not on charts or tablixes. In the following export, there's an action defined on the title and the table, but only the title can be clicked in PowerPoint.
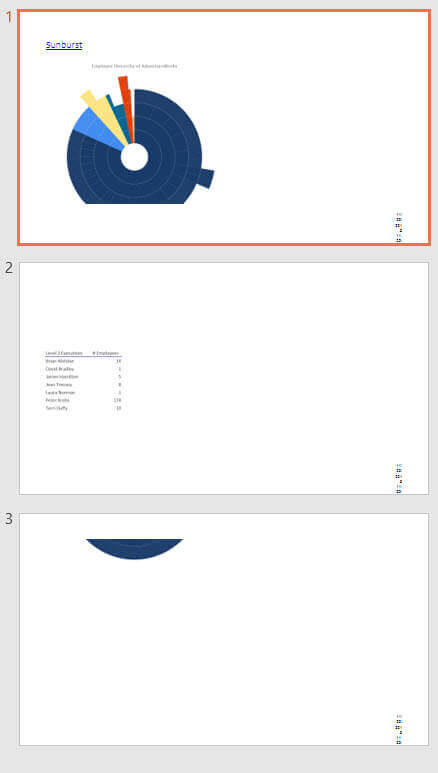
Just like in most rendering extensions - like PDF for example - you have to pay attention to the size of your report body and its objects inside. If not, it's possible your report is spread out over multiple PowerPoint slides. It can even happen that the generated image of your chart or table is divided in multiple pieces. Here is an example:
Next Steps
- For more information about SQL Server 2016, read these other SQL Server 2016 Tips.
About the author
 Koen Verbeeck is a seasoned business intelligence consultant at AE. He has over a decade of experience with the Microsoft Data Platform in numerous industries. He holds several certifications and is a prolific writer contributing content about SSIS, ADF, SSAS, SSRS, MDS, Power BI, Snowflake and Azure services. He has spoken at PASS, SQLBits, dataMinds Connect and delivers webinars on MSSQLTips.com. Koen has been awarded the Microsoft MVP data platform award for many years.
This author pledges the content of this article is based on professional experience and not AI generated.
View all my tips
Article Last Updated: 2016-01-11


