By: Daniel Farina | Updated: 2015-12-21 | Comments (8) | Related: > SQL Server Management Studio
Problem
In my previous tip about First Steps for SQL Server Performance Troubleshooting I briefly commented on the advantages of this free set of reports. Although you will find other tips about how to install them, in this tip I will show you its features and how to interpret these reports.
Solution
When you work as a SQL Server DBA in a production environment, speed is critical when you are facing an incident. We don't have much time to write complex queries to access the system views and for this reason most of us have a battery of queries ready to execute. But when a user complains about performance degradation he won't give you much detail other than "it doesn't work"; so you have to quickly figure out where the problem lies. That leads to the question: Which of my hundred queries should I run first? To help us, Microsoft created a set of free reports named Performance Dashboard Reports which be downloaded from this link: http://www.microsoft.com/download/en/details.aspx?id=29063.
After installing these reports using the steps provided on this tip Install SQL Server 2012 Performance Dashboard Reports you are ready to view the reports.
The next image is a screen capture that outlines what you are going to see.
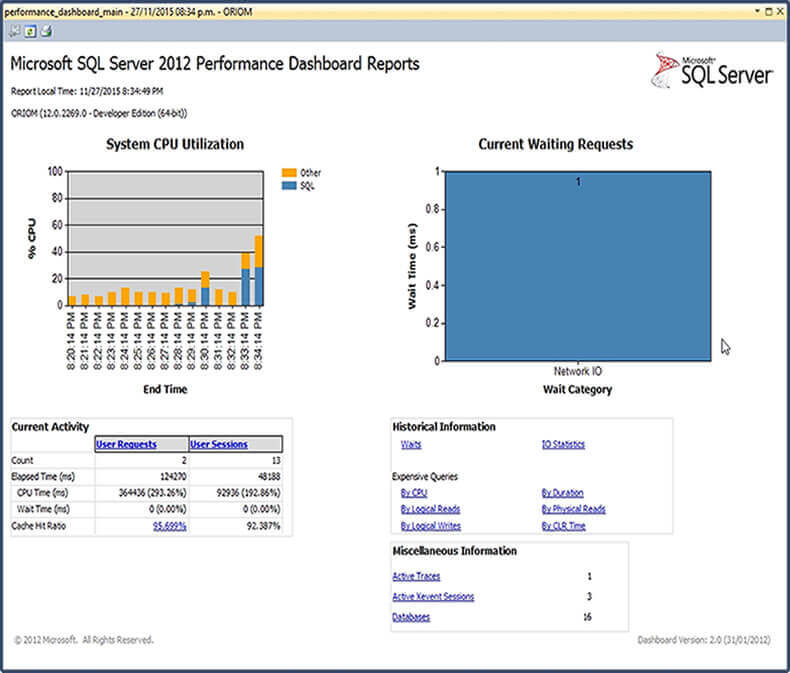
On the top of the report you will see two graphics. The one on the left shows the system CPU usage over time. Notice that the graphic bars have two colors in order to distinguish amongst the actual SQL Server instance CPU usage and the other system processes. I find it very useful to quickly determine if your instance is under CPU pressure (blue bars will be high), and even more useful when your SQL Server instance is running on a virtualized environment to detect CPU contention (orange bars will be high). But in order to confirm the CPU contention diagnosis you should check which server process is consuming that amount of CPU. If you are under CPU contention it will be the services.exe process, the system process or the interrupts. To do so I suggest that you use Microsoft's Sysinternals Process Explorer which you can download for free from this link https://technet.microsoft.com/en-us/sysinternals/processexplorer.
If you click on a bar in the graphic, you will be redirected to a sub-report that shows you an overview of the queries responsible for the recent CPU activity.
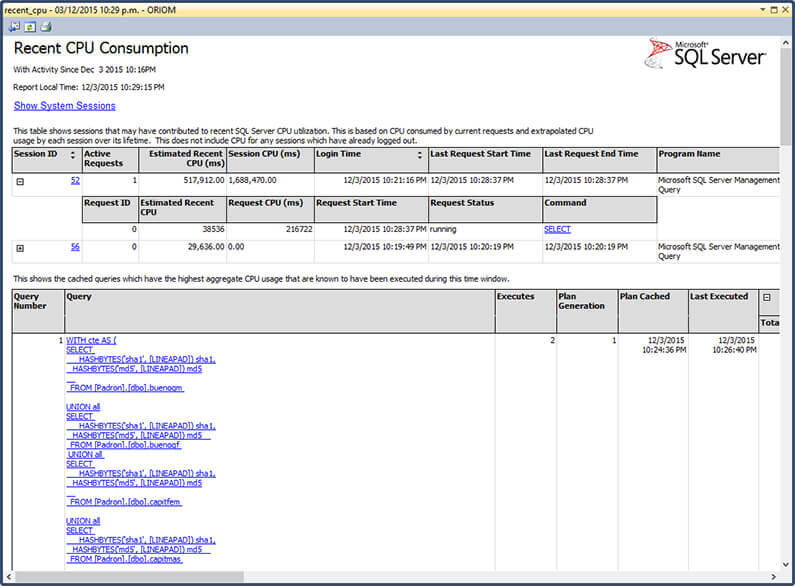
As a side note, this sub-report won't work if your regional settings are other than EN-US, because this sub-report receives the time of the bar you have clicked as a parameter of NVARCHAR data type instead of DATETIME. So if you experience this issue modify the following stored procedure to convert the DATETIME value to an ODBC canonical NVARCHAR string.
USE msdb
GO

ALTER PROCEDURE MS_PerfDashboard.usp_Main_GetCPUHistory
as
begin
	declare @ms_now bigint

	select @ms_now = ms_ticks from sys.dm_os_sys_info;

	select top 15 record_id,
		CONVERT(NVARCHAR(30), dateadd(ms, -1 * (@ms_now - [timestamp]), GetDate()),121 )as EventTime,
		SQLProcessUtilization,
		SystemIdle,
		100 - SystemIdle - SQLProcessUtilization as OtherProcessUtilization
	from (
		select
			record.value('(./Record/@id)[1]', 'int') as record_id,
			record.value('(./Record/SchedulerMonitorEvent/SystemHealth/SystemIdle)[1]', 'int') as SystemIdle,
			record.value('(./Record/SchedulerMonitorEvent/SystemHealth/ProcessUtilization)[1]', 'int') as SQLProcessUtilization,
			timestamp
		from (
			select timestamp, convert(xml, record) as record
			from sys.dm_os_ring_buffers
			where ring_buffer_type = N'RING_BUFFER_SCHEDULER_MONITOR'
			and record like '%%') as x
		) as y
	order by record_id desc

end
GO
The graphic at the upper right shows the current waiting requests by category. Something to note is that this graphic only shows information relative to user processes. As with the System CPU Utilization chart, you can click on the bars and it will take you to the General Waits sub-report. This sub-report will show the same graphic on the upper part and in the lower part it will show a table grouped by wait category where you can see the details about the wait type, the session waiting, the resource the session is waiting for and the query text.
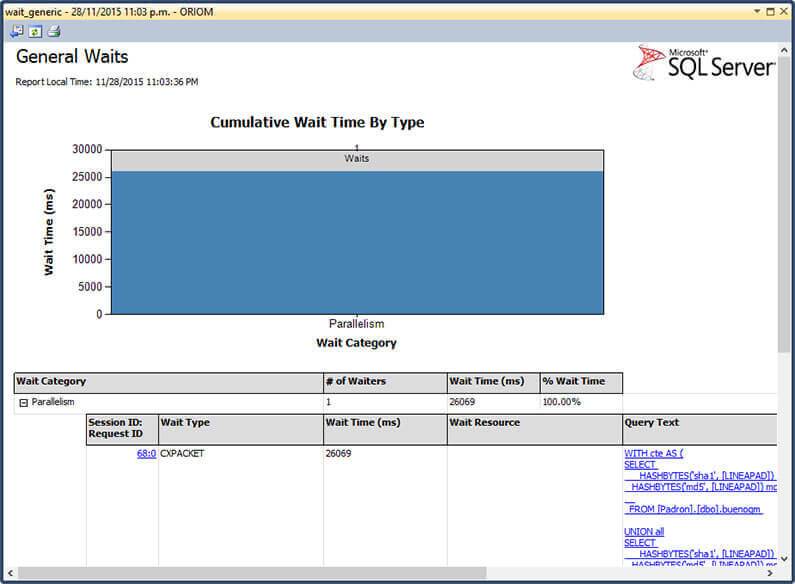
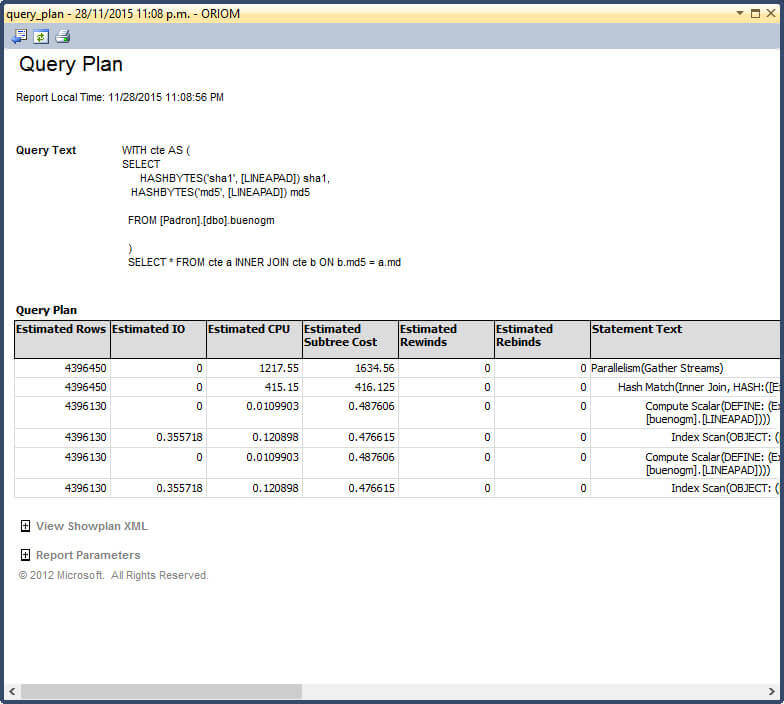
If you want, you can click on the query text to see the query plan in another sub-report.
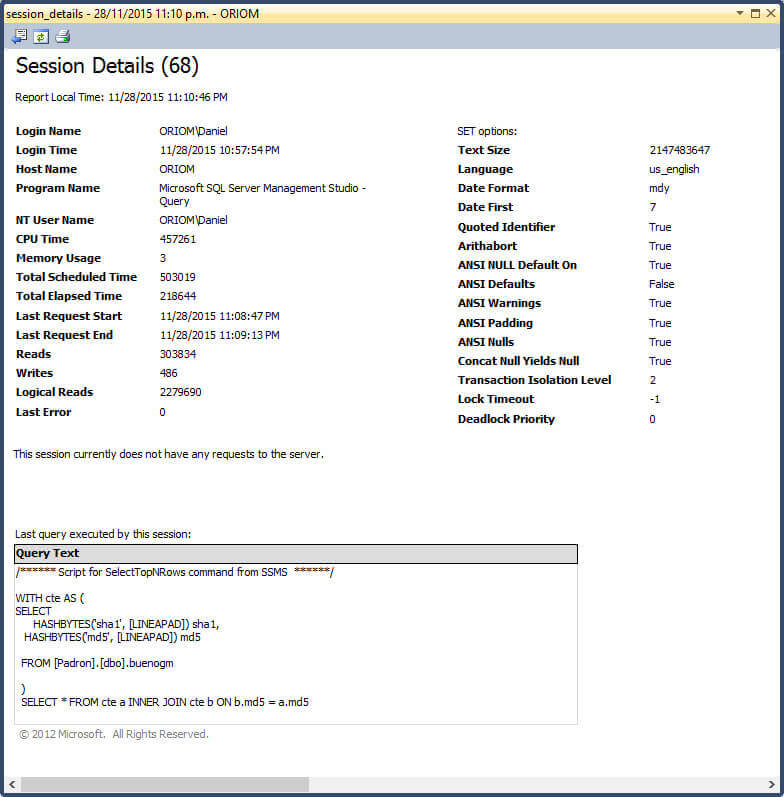
Also, if you click on the session id you will be redirected to a report showing the session details.
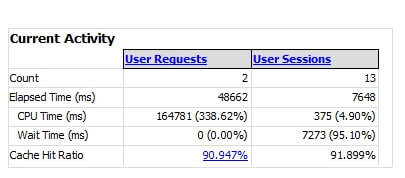
Back to the main report. On the lower part on the left there is a table that shows the current activity by sessions and active requests. The most relevant indicator of this table is the cache hit ratio (the percentage of pages found in the buffer cache without having to read from disk), if this value is too low you may need to increase the memory available for the instance.
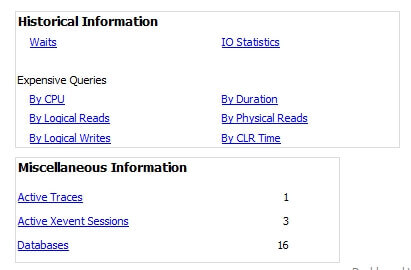
On the lower part on the right you will see two boxes grouping other sub-reports. The upper box group reports are related to historical information about waits and IO statistics. Also, it contains six reports about expensive queries: by CPU, by Duration, by Logical/Physical reads, by logical writes and by CLR time. The other box shows miscellaneous information like active traces and extended events sessions, databases information and missing indexes.
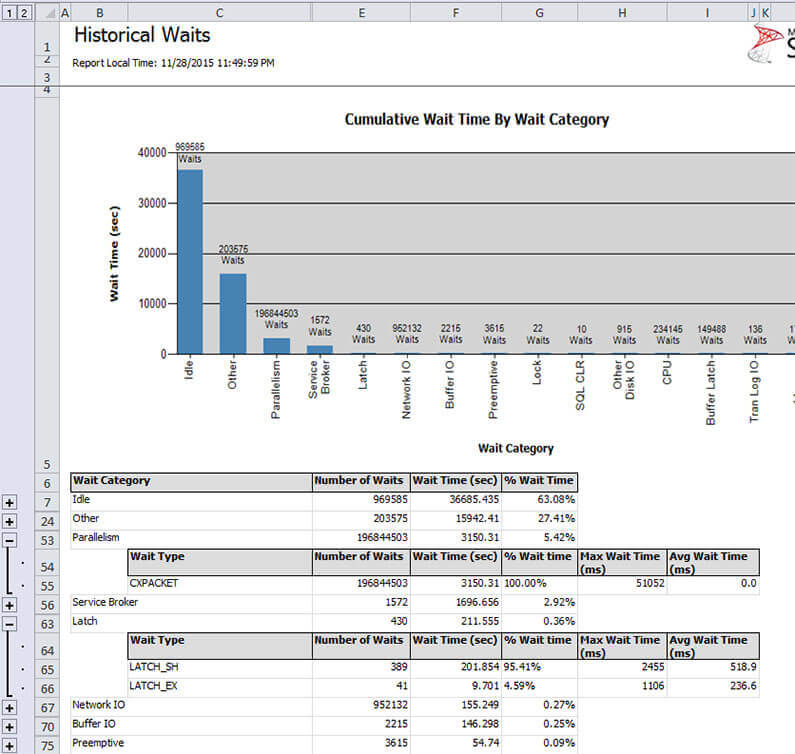
The Historical Waits report shows a bar chart resuming the wait time by category for a quick view and below it there is a table for a deeper analysis. The table shows the wait categories ordered by the percentage of wait time and gives us the option to expand a wait category to view its wait types also ordered by percentage of wait time. The next image below is a screen capture of this report exported to an Excel spreadsheet.
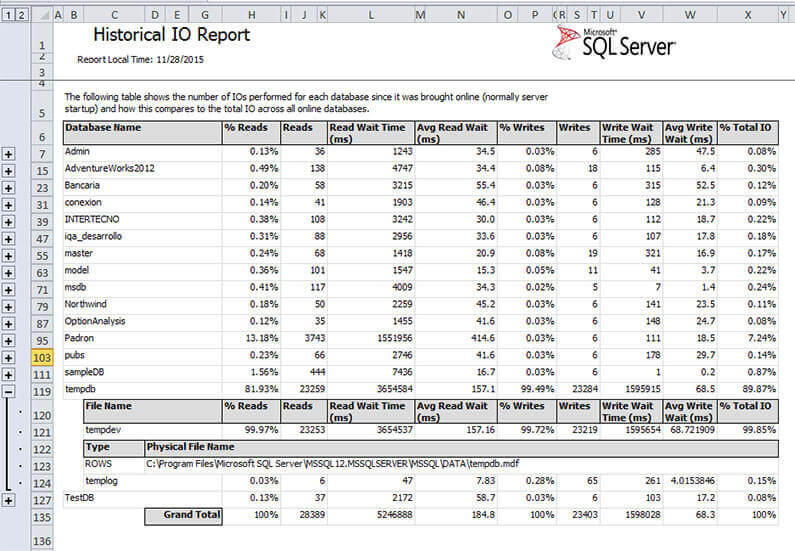
The Historical IO report shows a table ordered by Database Name with IO related information. The most useful columns are the percentage of total IO, the percentage of reads and writes and the average read and wait times.
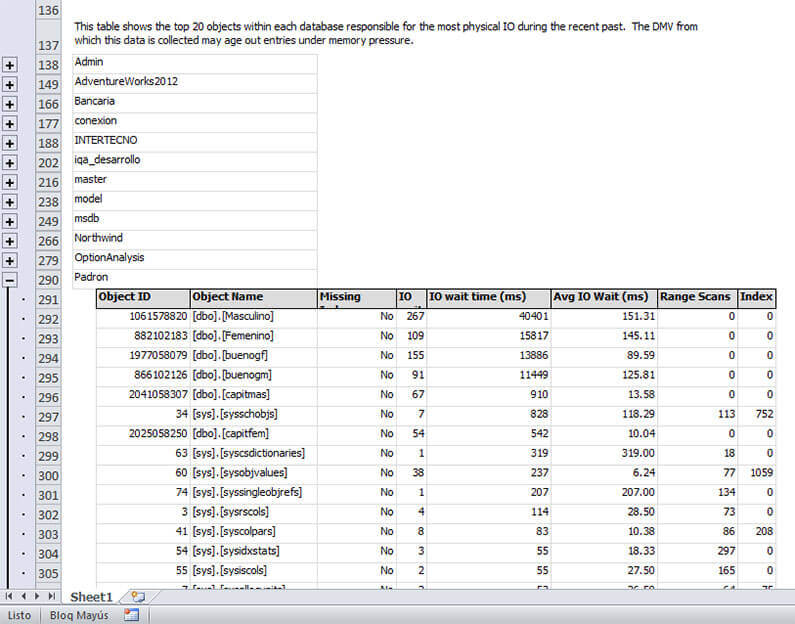
Below the previous table is a treeview with all the databases. When you expand any database it will show a table with the top 20 objects responsible of the most physical IO. This table gives us information about the number of object's index lookups and index range scans, if the object has missing indexes and IO wait information. One drawback is that this table includes system objects which could add some confusion when reading.
As you could see by now, this set of reports will aid you to get a quick server diagnostic. But I think that there is one point missing: volume free space. To compensate this I created a modified version of the main report with a new bar chart on the bottom that shows the available free space of disks that contains database files.
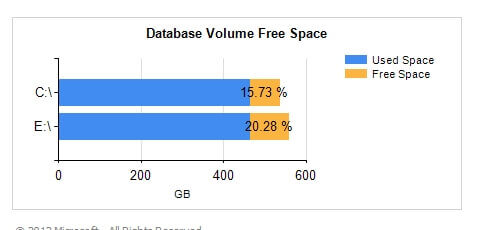
If you want to use this modification you will need to replace the performance_dashboard_main.rdl file with the one on this zip file and create the following stored procedure.
USE msdb
GO

CREATE PROCEDURE MS_PerfDashboard.usp_Main_GetFreeDiskSpace
AS

SELECT  volume_mount_point ,
        CAST(total_bytes / 1024 / 1024 / 1024 AS NUMERIC(20, 2)) [Used Space] ,
        CAST(available_bytes / 1024 / 1024 / 1024 AS NUMERIC(20, 2)) [Free Space] ,
        CAST(CAST(available_bytes * 100 / CAST(total_bytes AS NUMERIC(20, 2)) AS NUMERIC(5,
                                                              2)) AS VARCHAR(50))
        + ' %' AS [Percentage Free]
FROM    sys.master_files AS f
        CROSS APPLY sys.dm_os_volume_stats(f.database_id, f.file_id) b
GROUP BY b.volume_mount_point ,
        total_bytes ,
        available_bytes
ORDER BY volume_mount_point;

GO
Next Steps
- You can learn how to install the SQL Server Performance Dashboard reports in this tip: Install SQL Server 2012 Performance Dashboard Reports.
- This tip will explain you how to Detect SQL Server CPU pressure.
- Also if your problem is CPU related I suggest that you read this tip: How to Identify SQL Server CPU Bottlenecks.
- For more information about CXPACKET wait type read A closer look at CXPACKET wait type in SQL Server.
- When you are troubleshooting wait types you should look at sys.dm_os_waiting_task as well as sys.dm_os_wait_stats Dynamic Management View. So the following tip will give you insight: SQL Server sys.dm_os_wait_stats DMV Queries.
- If you want to avoid problems in your instance you should do maintenance work. If you don't now how or need to go further, check out the Maintenance Tips Category.
- Also check out the Performance Tuning Tips Category.
About the author
 Daniel Farina was born in Buenos Aires, Argentina. Self-educated, since childhood he showed a passion for learning.
This author pledges the content of this article is based on professional experience and not AI generated.
View all my tips
Article Last Updated: 2015-12-21


