By: Koen Verbeeck | Updated: 2016-02-15 | Comments (13) | Related: > SQL Server 2016
Problem
SQL Server 2016 comes with the integration of the popular language R into the database engine. This feature has been introduced in SQL Server 2016 preview CTP3.0 and is called SQL Server R Services. In previous tips we explained how to set-up the client and server machines, how to leverage the in-database computation engine for executing R scripts and how to execute R code using T-SQL. In this tip, we are going to combine all that knowledge to embed data visualizations created with R into Reporting Services (SSRS) reports.
Solution
SQL Server 2016 preview
As mentioned earlier, at the time of writing SQL Server 2016 is still in preview (at the time of writing CTP 3.1 has been released). This means that the features of R Services can still change and that functionality might change, disappear or be added.
Prerequisites
To completely understand this tip and to follow the examples along, please read the following tips first:
- SQL Server 2016 R Services: Executing R code in Revolution R Enterprise
- SQL Server 2016 R Services: Guide for Client Configuration
- SQL Server 2016 R Services: Guide for Server Configuration
- SQL Server 2016 R Services: Executing R code in SQL Server
The most important tips are the server configuration and how you can execute R code in SQL Server using T-SQL.
Creating an R plot using T-SQL
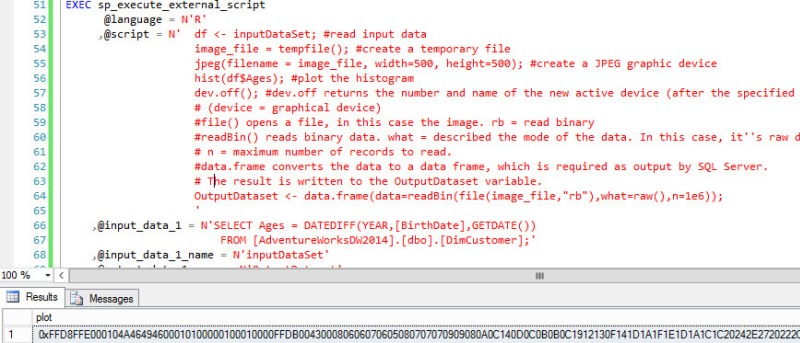
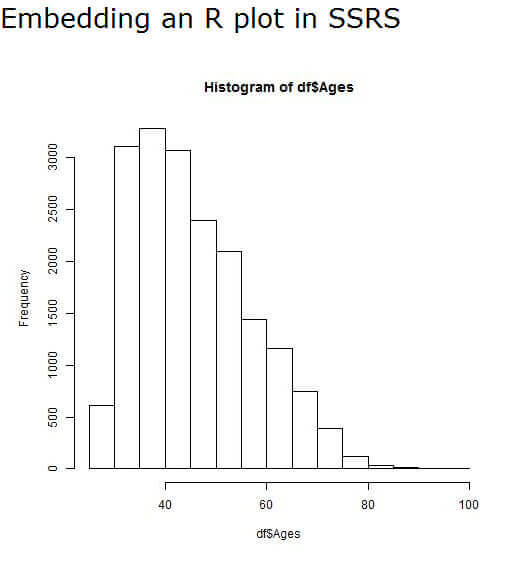
Using the stored procedure sp_execute_external_script we can use an R script to create a data visualization, also called a plot. In the following example, we are going to create a histogram plot of the various ages in the AdventureWorks customer dimension. The script looks as follow:
EXEC   sp_execute_external_script
      @language = N'R'
     ,@script = N'	df <- inputDataSet; #read input data
				image_file = tempfile(); #create a temporary file
				jpeg(filename = image_file, width=500, height=500); #create a JPEG graphic device
				hist(df$Ages); #plot the histogram
				dev.off(); #dev.off returns the number and name of the new active device (after the specified device has been shut down). (device = graphical device)
				#file() opens a file, in this case the image. rb = read binary
				#readBin() reads binary data. what = described the mode of the data. In this case, it''s raw data. n = maximum number of records to read.
				#data.frame converts the data to a data frame, which is required as output by SQL Server. The result is written to the OutputDataset variable.
				OutputDataset <- data.frame(data=readBin(file(image_file,"rb"),what=raw(),n=1e6));
					'
	,@input_data_1 = N'SELECT Ages = DATEDIFF(YEAR,[BirthDate],GETDATE())
						FROM [AdventureWorksDW2014].[dbo].[DimCustomer];'
	,@input_data_1_name = N'inputDataSet'
	,@output_data_1_name = N'OutputDataset'
WITH RESULT SETS ((plot varbinary(max)));
Let's go over the different steps of the script:
- First read the results of the query passed as input. The name given to this result set is inputDataSet. The result is stored in a data frame with the name df.
- Next a temporary file is created. This file will act as a placeholder for the JPEG image of our plot.
- The temporary file is defined as a JPEG graphic device, with width and height both equal to 500 pixels.
- Then the histogram is created over the Ages column of the df data frame using the hist function.
- If you would run the code inside a client environment, print(hist(x)) would create a separate window containing the data visualization. This is called a graphic device. dev.off() shuts down this device. Leaving this statement out of the script will result in an NULL value being returned, because dev.off() needs to return the number and name of the last active device.
- Finally the binary raw data of the temporary image file is being read using the functions readBin and file. The result is converted to a data frame with the data.frame function since SQL Server expects a data frame. The result is stored in the variable OutputDataset, which is defined as the output result set using the @output_data_1_name parameter of the stored procedure.
- In the WITH RESULT SETS clause, the output is described as a plot of data type varbinary(max).
When we run the stored procedure, we can see a binary string is being returned:
Embedding the plot in SSRS
The hard work has already been done. Using an INSERT ... EXEC statement, we insert the binary string in a table. In order to do this, the WITH RESULT SETS clause must be omitted, since the INSERT ... EXEC statement doesn't support this clause. First create a table to store the binary data:
IF NOT EXISTS (SELECT 1 FROM sys.objects
				WHERE	object_id = OBJECT_ID(N'[dbo].[Plots]')
					AND [type] IN (N'U'))
BEGIN
	CREATE TABLE [dbo].[Plots](
		[plot] [varbinary](MAX) NULL
	);
END
Now insert the data into the table using INSERT ... EXEC.
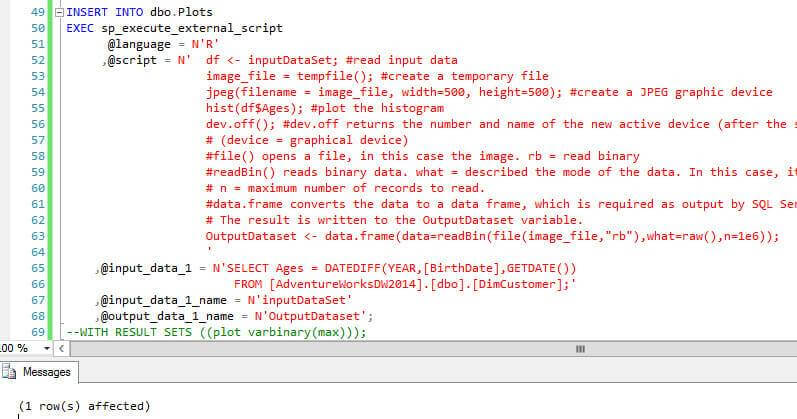
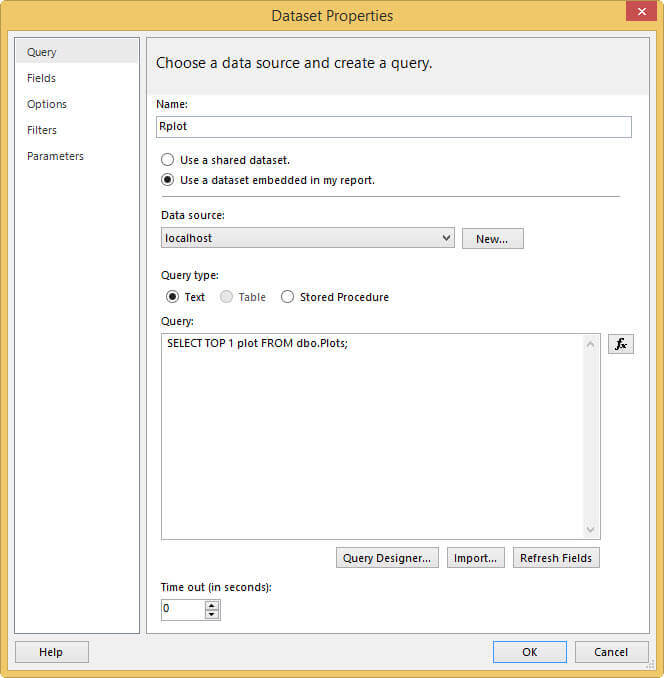
Now let's create a new report. Create a data source pointing to the database where the dbo.Plots table is located. Then create a dataset with the following SQL statement embedded:
SELECT TOP 1 plot FROM dbo.Plots;
The dataset looks like this:
Next create an image on to the report canvas.
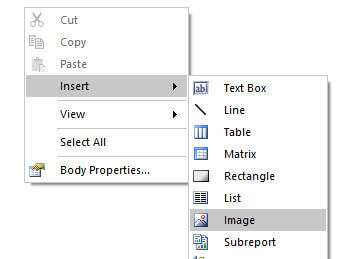
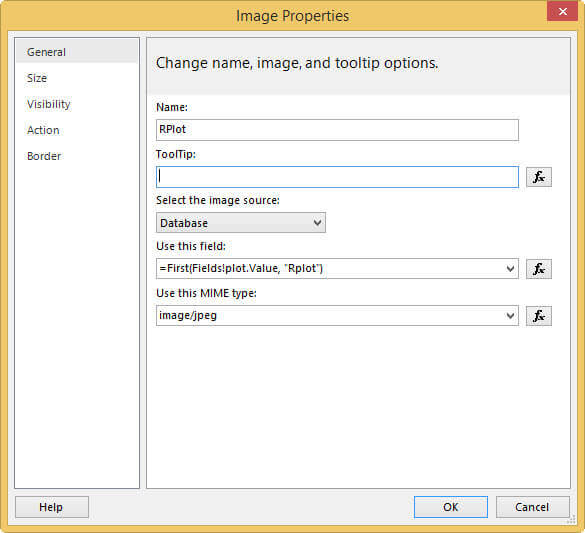
In the Image Properties dialog, set the image source to database. Use the field plot of the dataset and set the MIME type to jpeg.
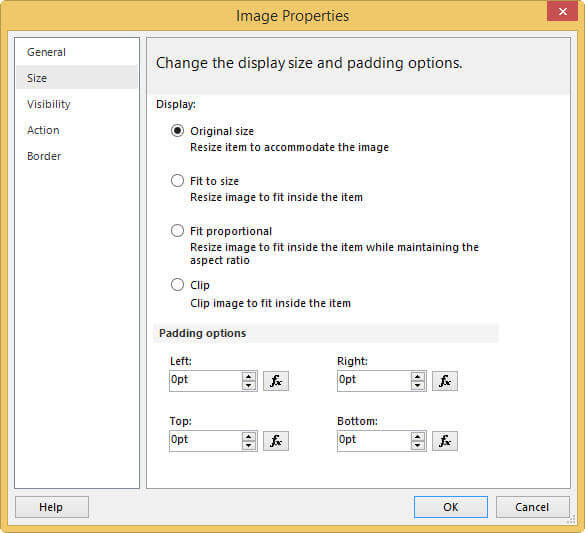
In the Size pane, set the display size to Original size.
When the report is run, it will show the jpeg file.
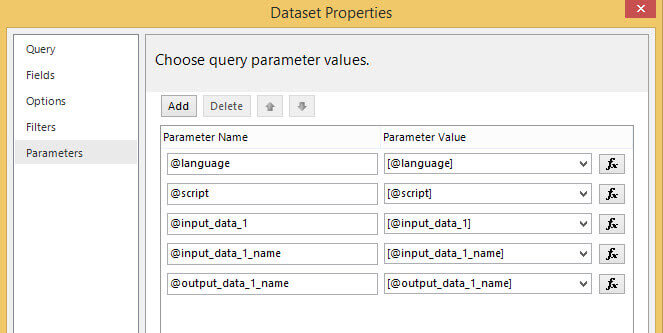
Note: directly using the stored procedure in the dataset doesn't work properly, as the SSRS reports creates report parameters for each parameter of the stored procedure. You can either select the results from a table - as we did before - or wrap the stored procedure inside another stored procedure.
Another example
In the blog post R You Ready For SQL Server 2016? of Jen Underwood you can find another example created by the Microsoft product team. The example uses a famous sample data set about flowers. The final (and slightly adjusted) script is as follows:
INSERT INTO dbo.Plots(plot)
EXEC   sp_execute_external_script
  @language = N'R'
 ,@script = N'
	library(ggplot2); #import ggplot2 library
	image_file = tempfile(); #create a temporary file
	jpeg(filename = image_file, width=600, height=800); #create a JPEG graphic device
	#qplot = quick plot, a helper function of ggplot2
	qplot(Sepal.Length, Petal.Length, data = iris, color = Species,
		xlab = "Sepal Length", ylab = "Petal Length",
		main = "Sepal vs Petal Length in Fisher''s Iris data");
	dev.off(); #dev.off returns the number and name of the new active device (after the specified device has been shut down). (device = graphical device)
	#file() opens a file, in this case the image. rb = read binary
	#readBin() reads binary data. what = described the mode of the data. In this case, it''s raw data. n = maximum number of records to read.
	#data.frame converts the data to a data frame, which is required as output by SQL 1Server. The result is written to the OutputDataset variable.
	OutputDataset <- data.frame(data=readBin(file(image_file,"rb"),what=raw(),n=1e6));
	'
 ,@input_data_1 = N''
 ,@output_data_1_name = N'OutputDataset';
The R script makes use of the ggplot2 package, a well-known package with powerful data visualization methods. It's possible you have to import this package first on your machine before you run the R script. When the same steps as in the previous section are followed, we get the following chart in SSRS:
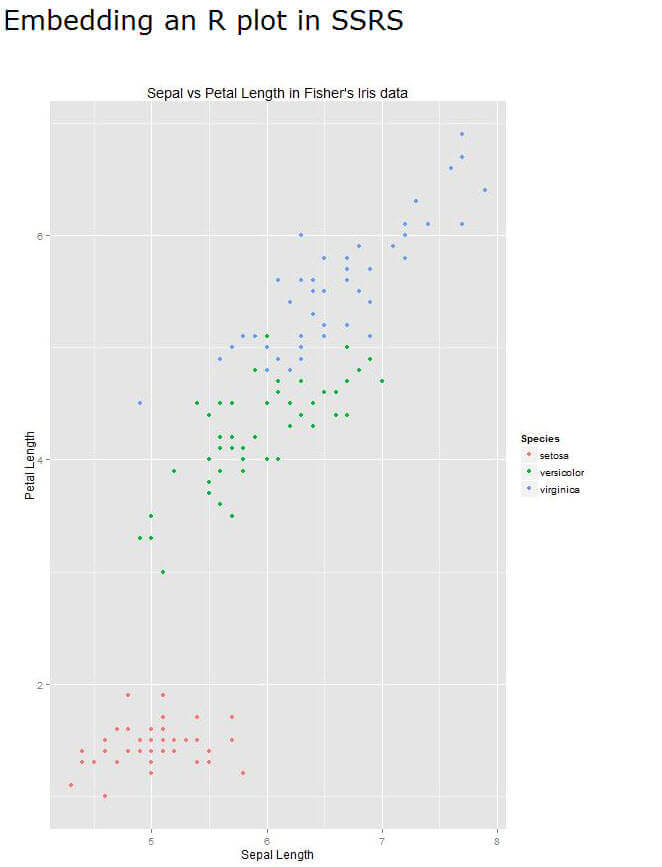
It's easy to see that with R you can quickly generate powerful data visualizations, some of which are real hard to create in SSRS with out-of-the-box capabilities.
Note: it's possible that the chart has the right size in the preview in Report Builder, but when you actually run the report in Report Manager it's a lot smaller. If that's the case, try setting the size property to Fit Proportional and resizing the image object on the report canvas to the desired size.
Conclusion
By using the graphic capabilities of the R language and the possibility to execute R scripts using T-SQL, it's straight forward to embed compelling data visualizations into SSRS reports. These graphs can fill the void of chart types who currently are not available yet in SSRS or which are hard to create.
Next Steps
- More tips on SQL Server R services
- For more info on R Services:
- The following article explains a nice use case where an R script is used to analyze performance bottlenecks on SQL Server: Combining R and SQL Server to diagnose performance bottlenecks. Using the information from that article and this tip, you could create a report showing you the bottlenecks of your SQL Server instance. Taking it one step further, you could embed the report in SSMS for quick analyses. Read the tip Adding Custom Reports to SQL Server Management Studio on how to do this.
- For more SQL Server 2016, read these other SQL Server 2016 Tips.
About the author
 Koen Verbeeck is a seasoned business intelligence consultant at AE. He has over a decade of experience with the Microsoft Data Platform in numerous industries. He holds several certifications and is a prolific writer contributing content about SSIS, ADF, SSAS, SSRS, MDS, Power BI, Snowflake and Azure services. He has spoken at PASS, SQLBits, dataMinds Connect and delivers webinars on MSSQLTips.com. Koen has been awarded the Microsoft MVP data platform award for many years.
This author pledges the content of this article is based on professional experience and not AI generated.
View all my tips
Article Last Updated: 2016-02-15


