By: Scott Murray | Updated: 2016-05-26 | Comments | Related: > Power BI
Problem
How can you enhance the Power BI Q & A functionality? Are there any advanced techniques to make the data interaction any easier? I need ways to enhance the accuracy and efficiency of Power BI Online Q & A queries.
Solution
In a previous tip we covered the basic Q & A functionality that is included by default within Power BI Online and Power BI Desktop. Some basic techniques that can be completed to assist Q & A in retrieving your intended data include:
- Using specific key words in your questions such as "show", "by", "where", "as"
- Utilizing the auto complete / auto suggestion functionality
- Specifying the visual you would like to see
- Using good naming conventions
These techniques are great, but to truly utilize the Q & A functionality, you can enhance the process by using some advanced methods to make the Q & A process even better. Some of the more advanced Q and A functionality is designed to help Power BI make interaction with you data easier and more analysis friendly. It means that users can get the data they want in the format they want and most importantly get the correct answer / data in a timely manner. Some of the advanced features and functionalities include the use of synonyms and adding featured questions. These methods are all items that dataset designers would utilize as opposed to items that could be implemented by Dashboard users. Let us get started on using these features.
Advanced Power BI Q & A Techniques
Save Featured Q & A Questions in Power BI
The first advanced technique is to save specific questions that will be offered as suggestion to Power BI users. In order to save a featured question for use with this functionality, you must first create a template question to use. The template then gets saved to a master set of questions that will be offered to all future Power BI users who are asking questions within this dataset.
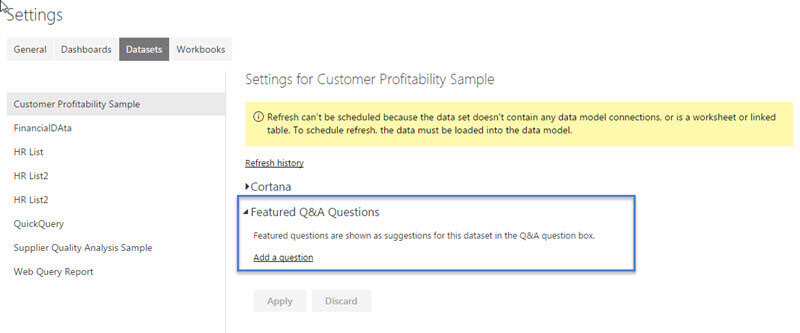
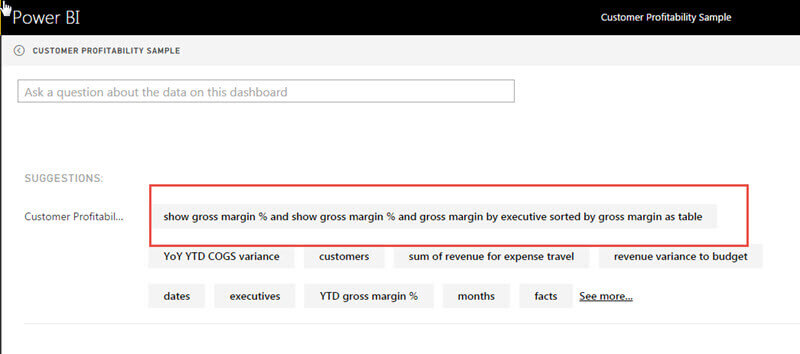
To create the template question you simply ask a question using the Q & A functionality. The key is to use a quality statement with well-chosen key words. In the below example, we ask for the gross margin and gross margin % by executive, sorted by gross margin and finally shown as a table.
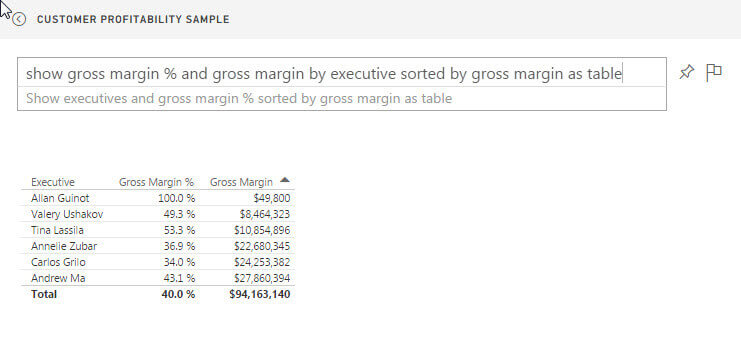
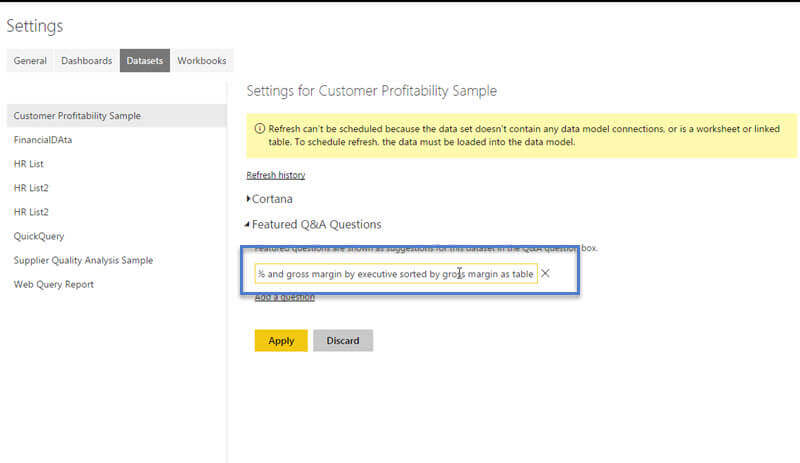
Adding a question in Power BI Online starts with going to Gears-Setting Button > Settings > Datasets > Add a question. Next you fill in the question you have designed and click apply.
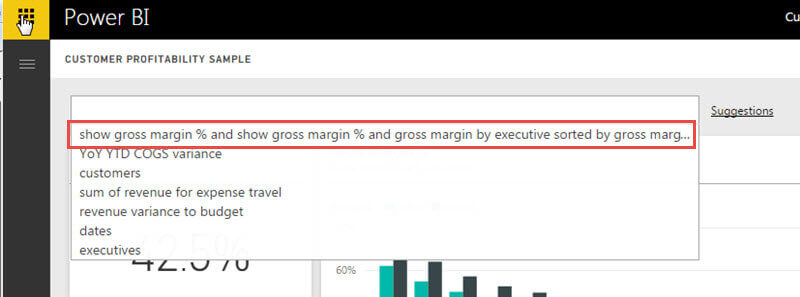
Now when the user clicks in the Q & A box or clicks on suggestions, the "saved" featured question(s) is presented to the dashboard user. You can create multiple featured questions for each dataset.
Synonyms in Power BI Q & A
Additionally as you work with datasets, you also would want to set appropriate synonyms. Synonyms work very similar to renaming columns, except the original column name can be retained. As shown in the first screen print below, we must add synonyms not in Power BI online, but in our original data set within the Power BI Desktop. The default synonym for each column in a dataset is the column or field name. To adjust synonyms for a field, go to the relationships tab and then click on a table which contains the field(s) that need synonyms.
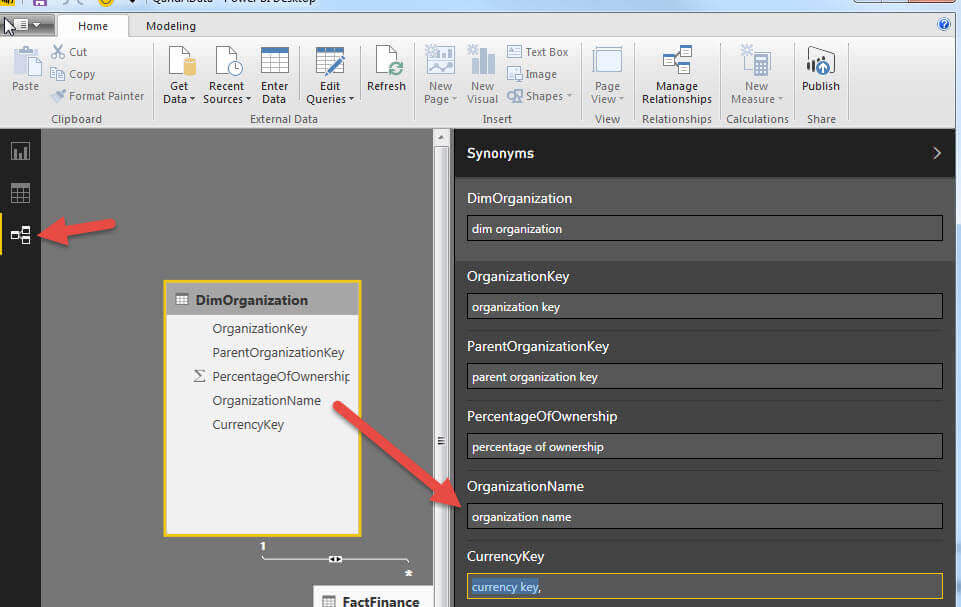
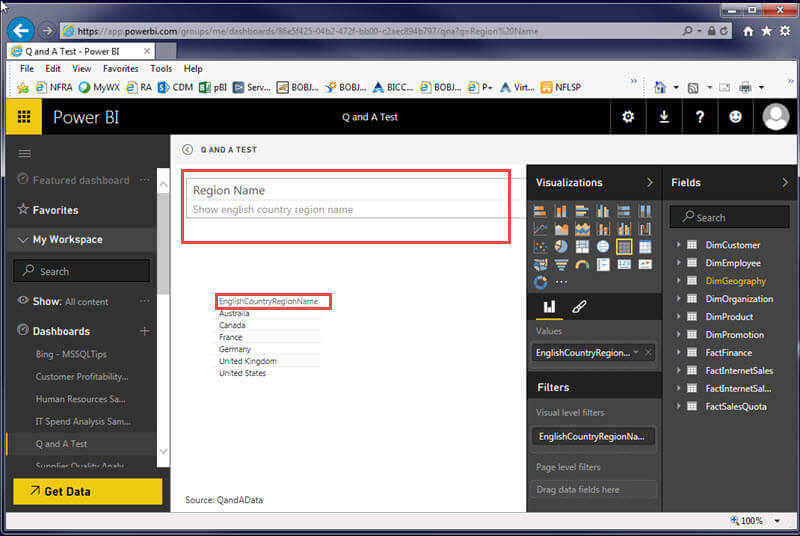
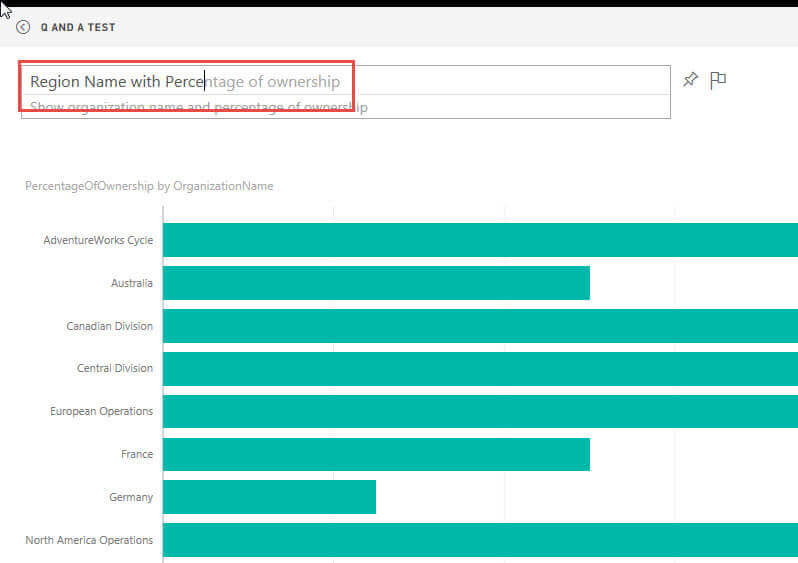
As an example, maybe the Organization Name field in the above illustration actually has a meaning of Region Name, Subdivision Name or Geo Name. If we attempt to use Region Name in the Q & A field, as shown next, a completely different field is displayed in the visualization.
In order to address this situation, we can add as many synonyms as necessary to the synonym list. In the below illustration, we add Region Name, Geo Name and SubDivision Name to the synonym list.
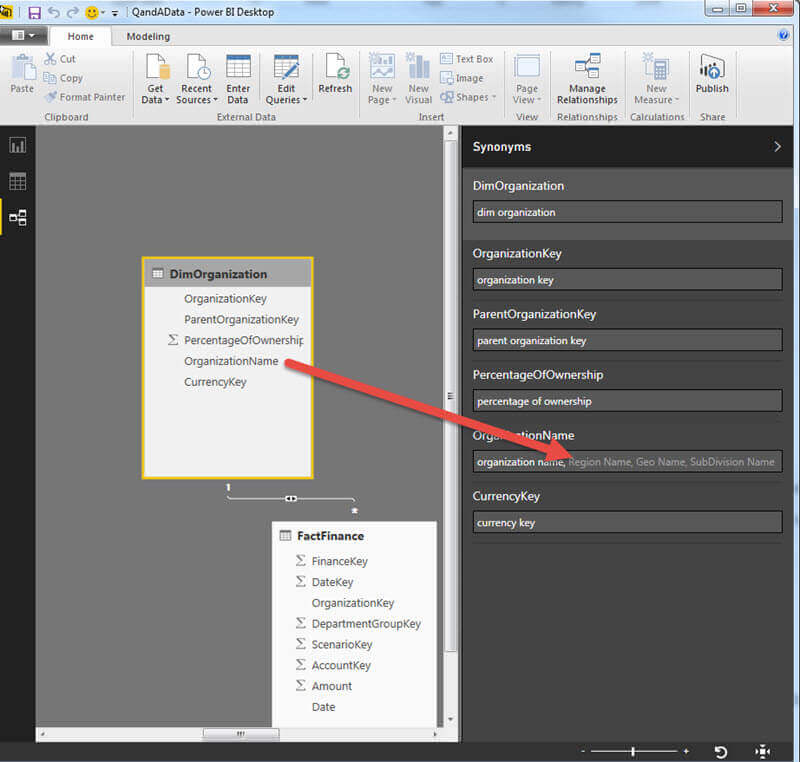
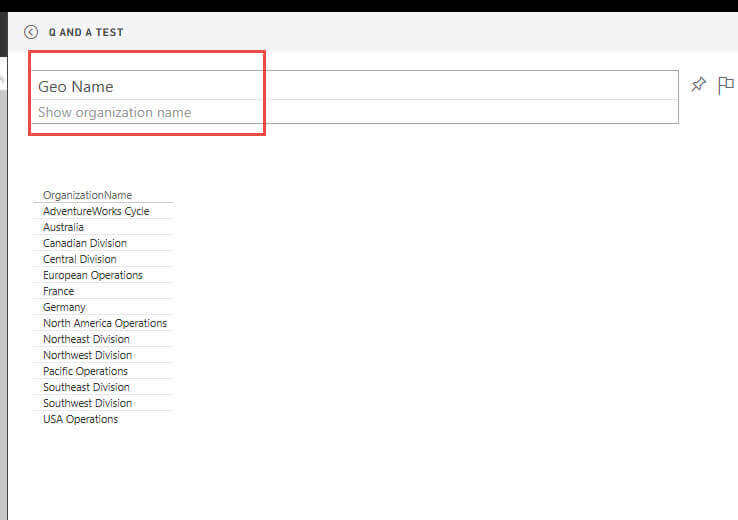
Now when we type Region Name or Geo Name in the Q & A box, Power BI immediately recognizes this term and equates it with the Organization Name field. This functionality is extremely useful when interacting with a dataset that contains fields that have different names within your organization. One caution about synonyms; as they are added to your field properties, you need to be sure they do not conflict with other names that are used in your dataset. These type of conflicts could "confuse" the Q & A functionality which in turn may provide data results that are not as expected.
Do Not Summarize in Power BI Q & A
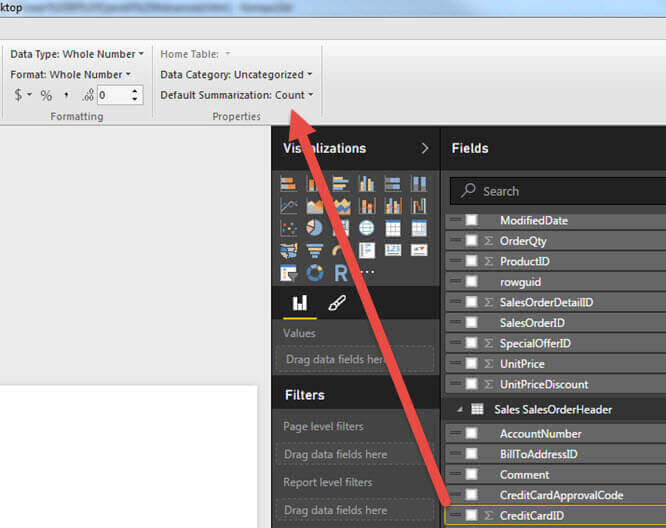
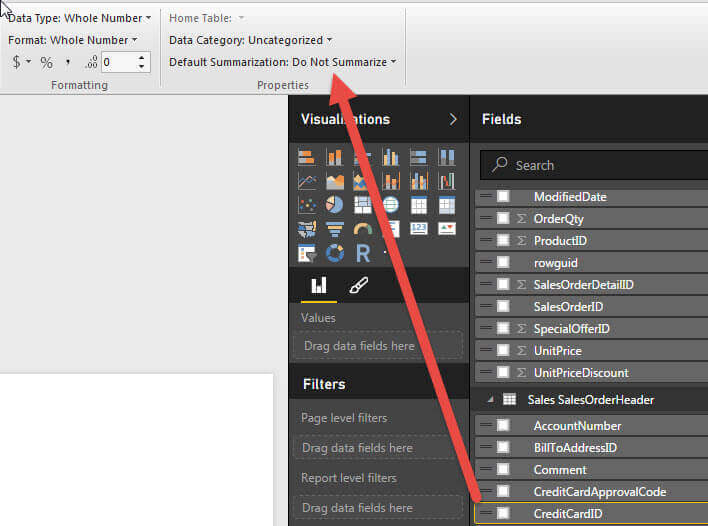
In a similar manner, often when you load a dataset into Power BI, you will have "numeric" fields which are not truly fields that should be summarized (or averaged). In these instances we would want to "turn off" summarization for these fields as it has no meaning. Thus, as shown in the below example, you would select the field in question and then change the Default Summarization to Do Not Summarize. Now the Q & A functionality will see this column is non-additive and not include a summary value (and also use it an attribute value and not a fact measure value).
Data Category Setting in Power BI Q & A
In a similar fashion, Q & A makes use of the Data Category setting to determine how to best show the results of a question. Zip / postal code is perfect example. As shown in the below figure, postal code is initially set as Uncategorized.
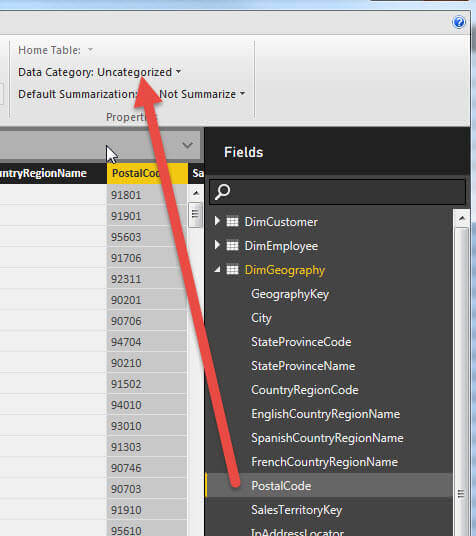
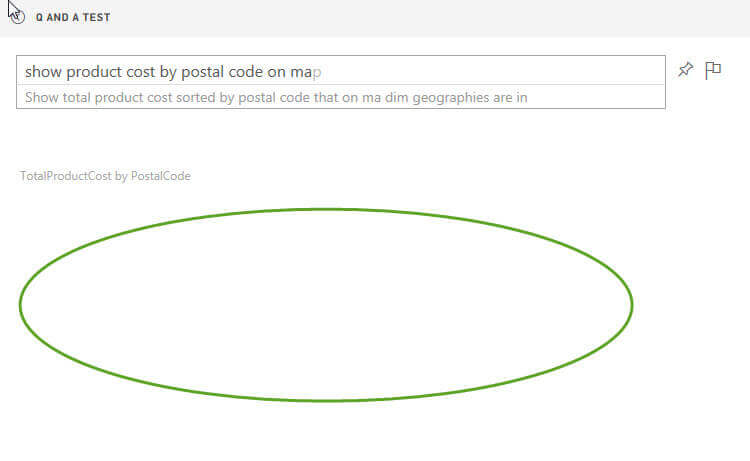
This means that the Q & A function does not realize that the field is geographic / location related and thus when requesting the product cost on a map by postal code, nothing is shown.
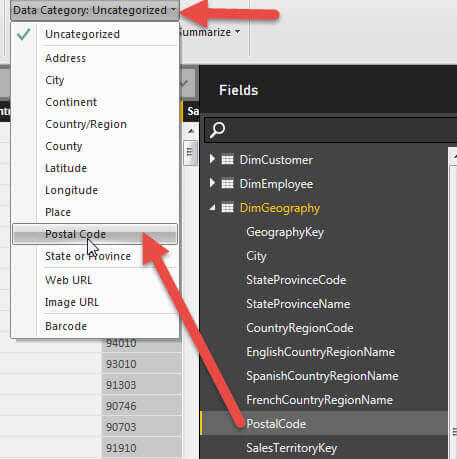
However, we can set the postal code field to a Data Category of Postal Code.
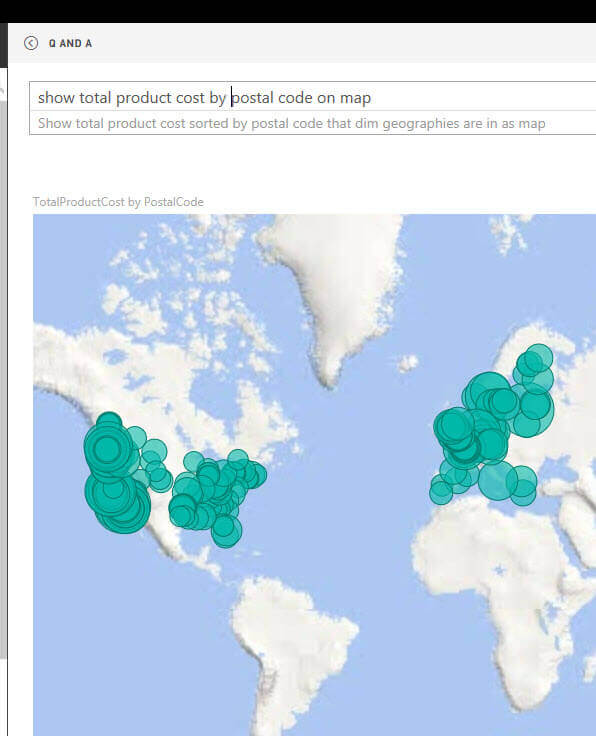
Now asking Power BI the same question, we see a bubble map created (of course we would likely need to zoom in on this map).
Conclusion
The advanced Q & A techniques in this article provide methods to enhance the accuracy and efficiency of Power BI Online Q & A queries. The synonym functionality provides a way to map non-descript field names into names that are meaningful to the users who will be querying the Power BI dashboards. Furthermore, setting the data category and default summarization allows Q & A to recognize the type of data that is being requested. The data categorization additionally permits Q &A to use the most appropriate visualization based on the requested data and requested visualization. All these items help to make Q & A more intelligent in the data that is selected and returned and certainly in how the data is presented and displayed to the Power BI User. The Power BI Excel tool also includes phrases and default fields functionality for Q & A; I am hoping this functionality will also come soon to Power BI Desktop and Power BI online.
Next Steps
- Check out these resources:
Learn more about Power BI in this 3 hour training course.
About the author
 Scott Murray has a passion for crafting BI Solutions with SharePoint, SSAS, OLAP and SSRS.
This author pledges the content of this article is based on professional experience and not AI generated.
View all my tips
Article Last Updated: 2016-05-26


