By: Scott Murray | Updated: 2016-08-09 | Comments | Related: > Power BI
Problem
I am always looking for new things that can be done with Power BI. What are some of the features that I can take advantage of to make using Power BI more productive?
Solution
In this tip we are going to cover three items centering around some questions I have seen posted on various blogs and message boards.
- First several folks have asked how to create an organization based template for branding reports with their company name and logo.
- Second, many folks have asked about printing reports and dashboards.
- Finally, as soon as your list of reports and dashboards begin to grow, it becomes more complex trying to find, execute and refresh your dashboards and reports. We will cover a new feature, favorites, that will help make that process easier.
In order to work with Power BI and Power BI Desktop, you need to do a few things to get everything setup for access and working with Power BI. First, you need to go to http://powerbi.microsoft.com and sign up to access Power BI. Note that you must use a work or school address to sign up for Power BI. Gmail, Yahoo, and similar accounts will not work. Next, I would recommend downloading the Power BI Desktop tool from: http://go.microsoft.com/fwlink/?LinkID=521662. Once you have your account setup and your Power BI Desktop application installed, you are ready to start exploring the features available in Power BI.
Create a Power BI Template
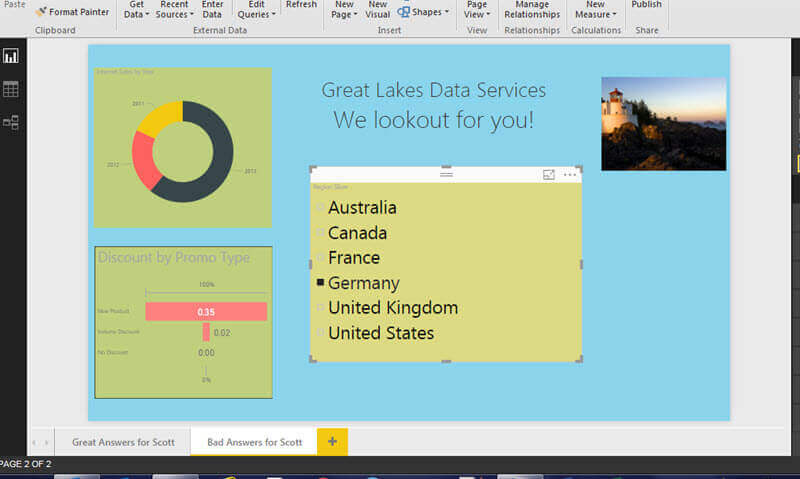
One of the newest features in Power BI is the ability to create a template for use by report and dashboard designers. Often when working within an organization, you will want to formulate a standard look and feel for your reporting structures. Items such as header text and logos, font sizes, background colors, and fonts can be customized. The first step in creating a Power BI template is to open Power BI desktop and begin the design process. As shown below, I created a simple report with a company header, an image and set background colors. Also, part of the template is a pre-selected set of country values that can be used in filtering other visualizations on report.
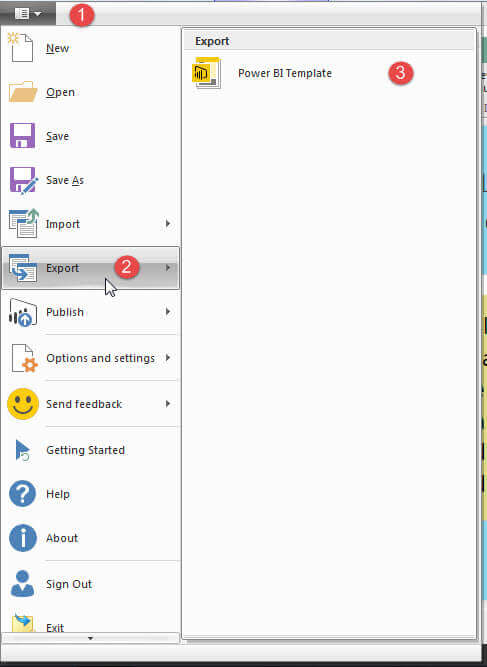
Now that my basic template is complete, we can go ahead and save it as a Power BI Template. In order to do so, we must go to File > Export > Power BI Template, as shown below.
Next we are given the opportunity to add a description for the template.

Finally, the file is saved as a template file with a PBIT file extension.

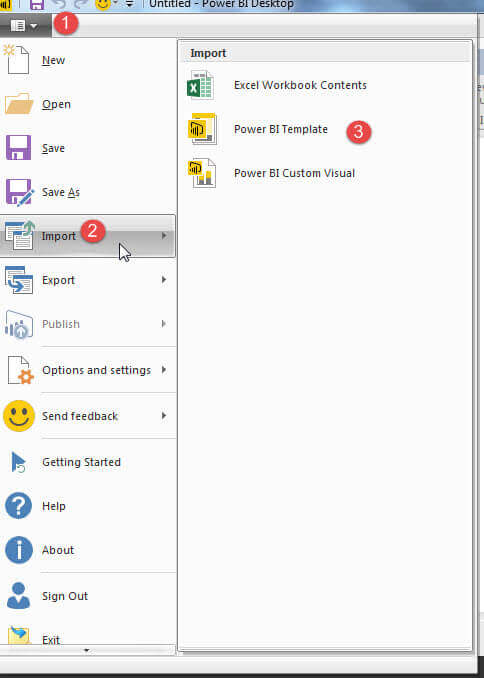
Now we can import the template and use it as the basis for another report.
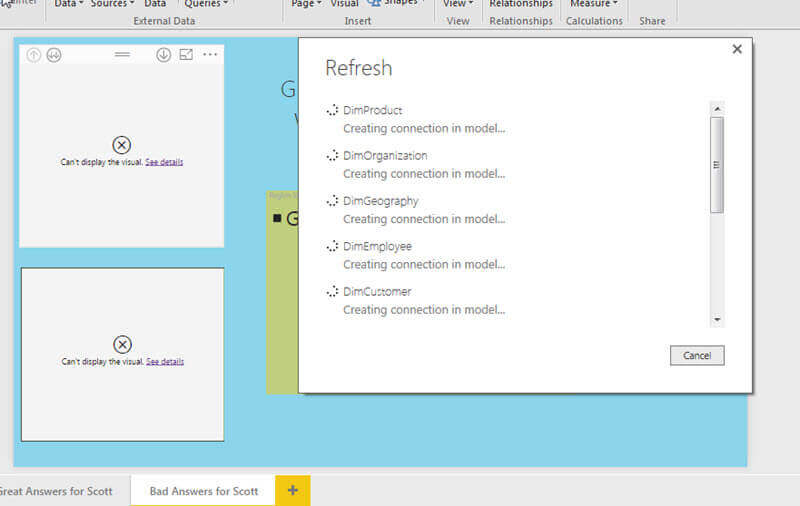
It usually takes a minute or two for the template to load; while loading a screen similar to the below screen print will appear.
Finally a new, untitled Power BI file is loaded.
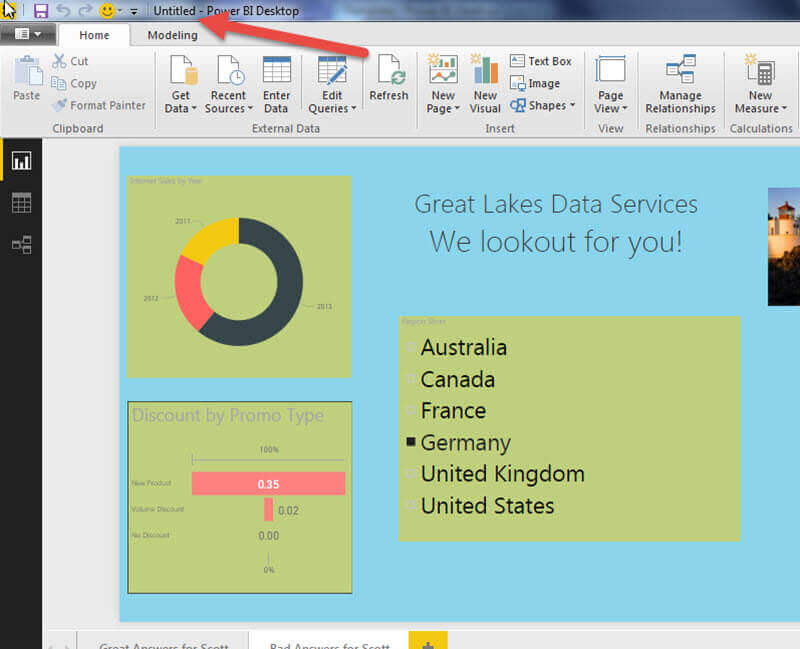
Of course one of the main advantages of creating a template is consistency; furthermore, as you will notice in the below screen print, the file size of the template is much smaller than the file of the regular Power BI file, because the data is not saved in the template. Additionally, the template file can be shared between users even by emailing to another user.

The one big caveat about templates usage is that templates can only be created in Power BI desktop; you cannot create templates in the online version of Power BI.
Printing ... Finally in Power BI
In the initial versions of Power BI online, print capabilities were not present. However in the latest version of Power BI, you have two options for printing. First, you can print an entire dashboard by selecting a dashboard and then click the ellipse button in the upper right corner. Next, as shown below, click on print dashboard.

This process prints the entire dashboard in one sitting. Notice the scale matches the scale on the dashboard.
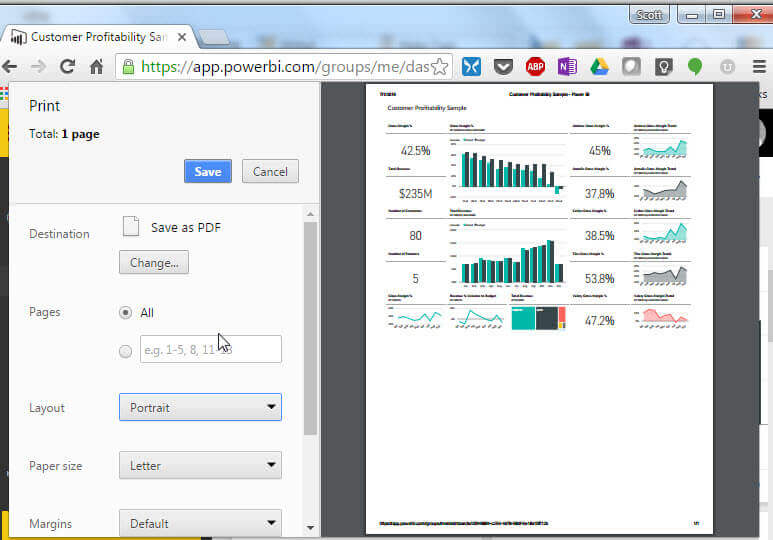
In addition to printing a dashboard, individual reports can also be printed by first selecting a report. Then, you would select File and Print.

When printing reports, only the selected report page is printed; other pages that are part of the report will not print.

Contrary to Power BI Templates, printing of dashboards and reports is only available in Power BI online. I know many users are requesting the ability to print from Power BI Desktop; many of these same users are requesting the ability to export or print to PDF natively. Hopefully these items will be added in the near future, but as of now for pdf printing you can use many of the freely available print to pdf print drivers.
Favorites in Power BI
The final new feature we are going to cover in this tip is setting a dashboard as "a favorite". Similar to bookmarks in a web browser, we can set a dashboard as one of your favorite dashboards. You do so by selecting the dashboard in question and then clicking the Favorite star button.

To navigate to your favorites, you would use the left tool bar menu (you can open it if it is closed by clicking on the 3 horizontal lines button).

Any dashboards that have been added to your favorites now show up in the main dashboard area. You can open the dashboard by clicking on it.
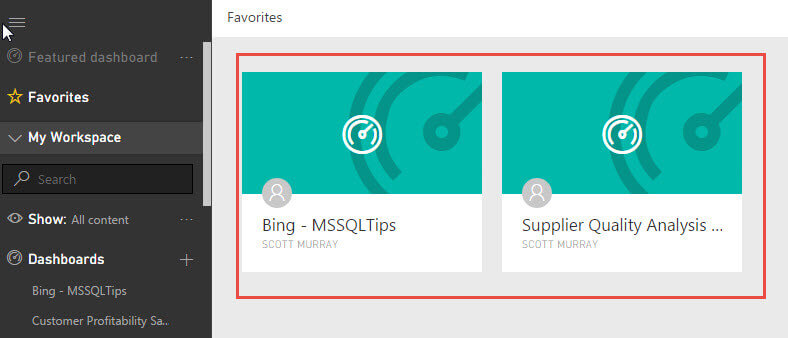
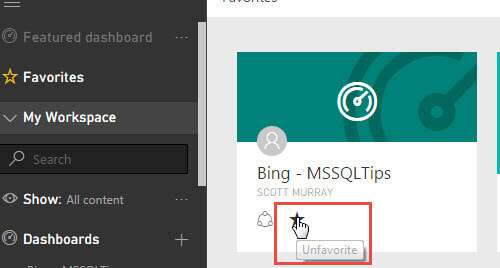
If you would like to remove the dashboards from your favorite set, you can click on the start button to un-favorite it. You can do so on the Favorites window, as illustrated below, or you can un-favorite on the individual dashboard screen.
Conclusion
In this tip, we covered three seemingly different features available in Power BI online and Power BI Desktop. First, we covered creating a template file for future use in Power BI Desktop. Next, we reviewed the process of printing from Power BI online, and finally we covered creating a set of favorite dashboards for use in Power BI online.
Next Steps
- Review all the Power BI Tips on MSSQLTips
Learn more about Power BI in this 3 hour training course.
About the author
 Scott Murray has a passion for crafting BI Solutions with SharePoint, SSAS, OLAP and SSRS.
This author pledges the content of this article is based on professional experience and not AI generated.
View all my tips
Article Last Updated: 2016-08-09


