By: Siddharth Mehta | Updated: 2016-09-02 | Comments (1) | Related: > Analysis Services Performance
Problem
In SQL Server Analysis Services (SSAS), when an MDX query is executed, it makes calls to the formula and storage engine to calculate and retrieve data. If a query does not find the requested data from aggregations, it would have to calculate the aggregations on demand, which impacts query performance. In this tip, we will learn how to create custom aggregations to meet the needs of any query.
Solution
Many times even though aggregations are in place, certain queries are not able to benefit from the aggregations as the attributes used in the query are not included in the aggregations developed by the aggregation wizard. Consider a scenario using the AdventureWorks sample cube from Microsoft. Let's say that we have a need where users query Internet Sales Amount from the Internet Sales measure group, split by the Color attribute from the Product dimension.
In this case, we need to design an aggregation on the Internet Sales measure group which has the Color attribute selected in the dimension. Follow the steps below to design an aggregation that the above defined query can use.
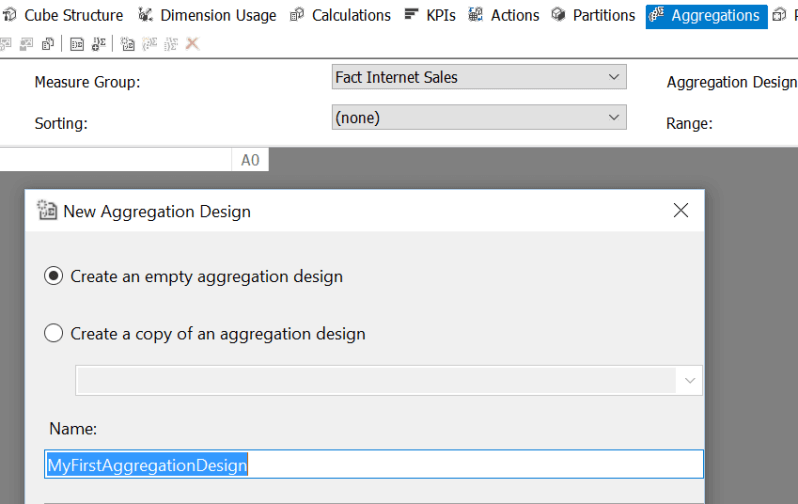
Step 1: The first step is to create a new blank aggregation, assuming that no aggregations exist. You may also choose to edit an existing aggregation, or create a new one depending upon the aggregations you have in place on the targeted measure group. Open the AdventureWorks sample cube, and navigate to the Aggregations tab. Click on the Advance view to design a custom aggregation. Select Fact Internet Sales measure group, right-click and select menu option "New Aggregation Design". This should bring up a pop-up as shown below. Select "Create an empty aggregation design", provide an appropriate name for the same and click OK to save the aggregation.
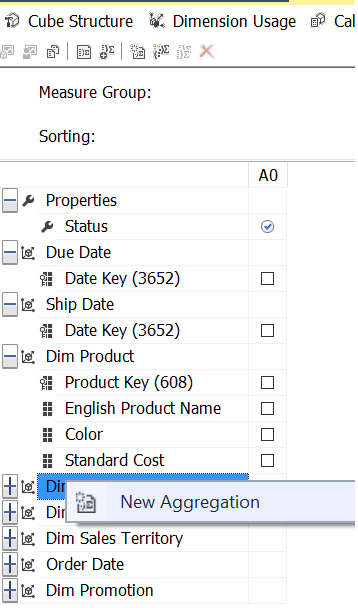
Step 2: Considering that the new aggregation design is created, right-click on the empty aggregation design and select the menu item "New Aggregation". This should bring up a screen as shown below. You can have a different number of attributes in the product dimension depending upon your cube design. Our intention is to split Internet Sales Amount by the Color attribute. So check the Color attribute and save the aggregation.
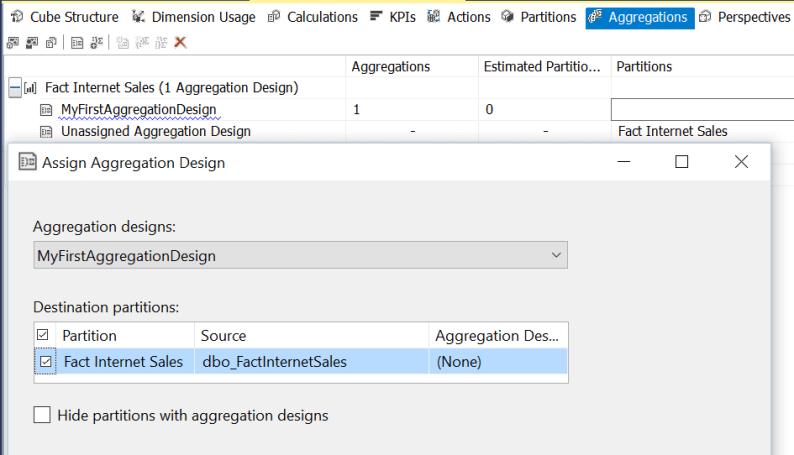
Step 3: Select the Partitions ellipsis for the newly created aggregation design, and assign the partition for the same by clicking on the partition ellipsis, as shown below. Deploy the cube and process the measure group if required depending on your cube design.
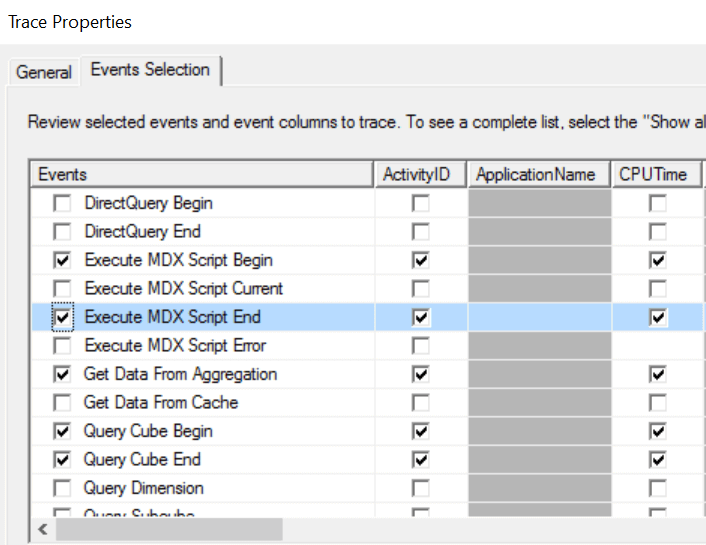
Step 4: Before we start querying the cube, let's open Profiler. Create a new trace file for SSAS, select a blank template and select the events as shown below. "Get Data from Aggregation" is the event that would be fired, once the query analyzer fetches data from the aggregation. Start the trace in Profiler.
Step 5: Browse the cube. Select Internet Sales Amount, followed by Color attribute from Products Dimension, and then any other attribute as shown below.
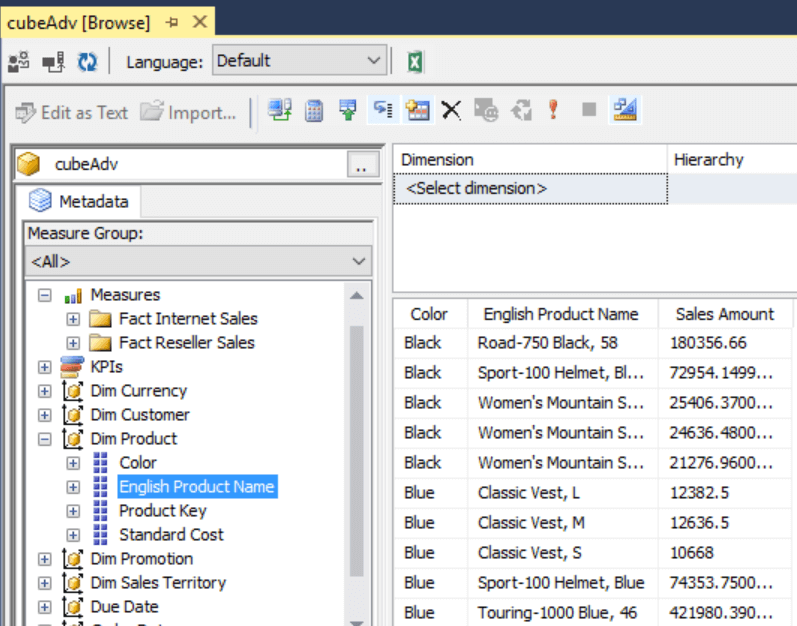
Step 6: If you look at the data from Profiler, you are able to see that when you selected the measure or the Color attribute, data was read from the aggregation. But when you select any other attribute, data was not read from the aggregation as the attribute was not a part of the aggregation design.
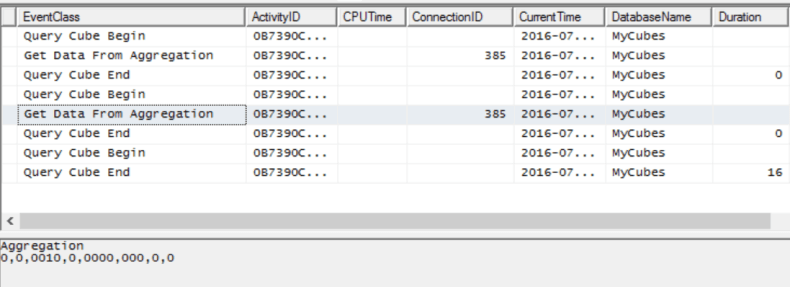
In this way, depending upon the attributes and measures selected, you can ensure that your existing aggregations or new aggregations are designed such that your queries can benefit from the same.
Next Steps
- Try to create a more complex MDX query, and design an aggregation to optimize the performance of the query in the above mentioned way.
- Check out all of the SQL Server Business Intelligence Tips.
About the author
 Siddharth Mehta is an Associate Manager with Accenture in the Avanade Division focusing on Business Intelligence.
This author pledges the content of this article is based on professional experience and not AI generated.
View all my tips
Article Last Updated: 2016-09-02


