By: Ahmad Yaseen | Updated: 2016-10-26 | Comments (1) | Related: > SQL Server 2016
Problem
I noticed that in SQL Server 2016 the system catalog view sys.dm_exec_query_stats has many new columns. What are these and how they be used?
Solution
The sys.dm_exec_query_stats system catalog view is mainly used to return one row per each query plan within the plan cache that contains aggregate performance data of that query plan. The query performance data can be retrieved from the view unless the plan is removed from the plan cache.
In SQL Server 2016, the sys.dm_exec_query_stats is improved by adding 24 new columns that include information about the query degree of parallelism, threads and memory consumption.
If you expand the master database system views node using the SQL Server Management Studio in both SQL Server 2014 and SQL Server 2016 you will notice the extra 24 columns in SQL Server 2016 as in the below image:

Simple Select of the DMV
We will run a simple SELECT statement on the sys.dm_exec_query_stats system view and use the output in the following sections.
SELECT * FROM sys.dm_exec_query_stats
New Degree of Parallelism Columns
The first four new columns describe the degree of parallelism of the query plan. Degree of parallelism determines how many processors will be used by a single query plan.
- total_dop - shows the total number of degree of parallelism this query plan used since the query compilation
- last_dop - shows the last degree of parallelism used for the query
- min_dop - shows the minimum degree of parallelism used for the query
- max_dop - shows the maximum degree of parallelism used for the query
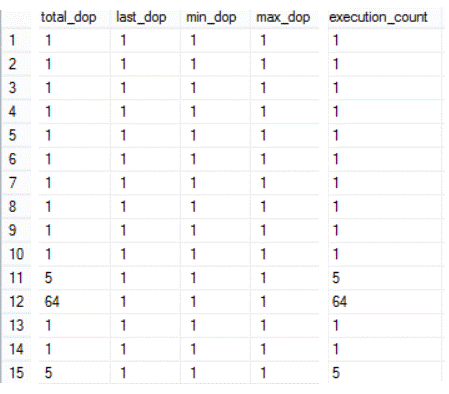
The below screenshot shows just the degree of parallelism columns:

You can see from the result that all these queries are using serial plans (each execution uses only one DOP) and the total_dop is equal to the execution_count.
New Memory Consumption Columns
The second group of columns include 12 columns that describe the query plan memory consumption in KB.
- total_grant_kb - is the total amount of memory granted to the query plan since the query compilation
- last_grant_kb - shows the amount of memory granted to the query plan in the last query run
- min_grant_kb - shows the minimum amount of memory granted to the query plan
- max_grant_kb - shows the maximum amount of memory granted to the query plan
- total_used_grant_kb - is the total amount of memory used by the query plan since the query compilation
- last_used_grant_kb - shows the amount of memory used for the query plan in the last query run
- min_used_grant_kb - shows the minimum amount of memory used to the query plan in a single execution
- max_used_grant_kb - shows the maximum amount of memory used to the query plan in a single execution
- total_ideal_grant_kb - is the total amount of ideal memory granted to the query plan since the query compilation
- last_ideal_grant_kb - shows the amount of ideal memory granted to the query plan in the last query run
- min_ideal_grant_kb - shows minimum amount of ideal memory granted to that query plan in a single execution
- max_ideal_grant_kb - shows maximum amount of ideal memory granted to that query plan in a single execution
I broke the screen shot into two parts for easier reading.

The following image shows the ideal granted memory statistics that is retrieved from the system view, where the ideal memory can be evaluated by multiplying the query required memory with the degree of parallelism and add the result to the additional memory amount.

New Parallel Threads Columns
The last group consists of 8 columns that describe another resource used by SQL Server parallel query plans which is parallel threading.
- total_reserved_threads - shows the total number of parallel threads reserved by the query plan since the query compilation
- last_reserved_threads - is the number of parallel threads reserved by the query plan at the last query run
- min_reserved_threads - shows the minimum number of parallel threads reserved by the query plan in a single execution
- max_reserved_threads - shows the minimum number of parallel threads reserved by the query plan in a single execution
- total_used_threads - shows the total number of parallel threads used by the query plan since the query compilation
- last_used_threads - is the number of parallel threads used by the query plan at the last query run
- min_used_threads - shows the minimum number of parallel threads used by the query plan in a single execution
- max_used_threads - shows the maximum number of parallel threads used by the query plan in a single execution
The statistics below show that all the queries below are serial query plans with no threading reservation:

Using the New Columns to Evaluate a Query
The new enhancement to the sys.dm_exec_query_stats system view makes it very useful in checking resources consumed by each query plan. This can be combined with other DMVs in order to get more information about the query plan. One example is to use it with the sys.dm_exec_sql_text(sql_handle) DMV to get the text for each query such as the below query:
SELECT *
FROM sys.dm_exec_query_stats
CROSS APPLY sys.dm_exec_sql_text(sql_handle)
The results will be like this. Here we can see the query text and also get information about memory usage and parallelism.

Next Steps
- To learn more refer to this information: sys.dm_exec_query_stats (Transact-SQL)
- Check out SQL Server Monitoring tips
About the author
 Ahmad Yaseen is a SQL Server DBA with a bachelor’s degree in computer engineering as well as .NET development experience.
This author pledges the content of this article is based on professional experience and not AI generated.
View all my tips
Article Last Updated: 2016-10-26


