By: Nat Sundar | Updated: 2016-11-24 | Comments (1) | Related: More > Integration Services Development
Problem
How do I debug Control flow logic in SQL Server Integration Services?
Solution
Debugging will help us find and resolve an issue in an SQL Server Integration Services (SSIS) package and we can debug the control flow in three ways:
- Setting up breakpoints
- Using Progress tab information
- Using Debug windows
Setting up breakpoints in SQL Server Integration Services
In SSIS, breakpoints can be enabled by using the Set Breakpoint dialog box. This is achieved by enabling break conditions based on the need.
In the SQL Server Data Tools (SSDT) we can set up two types of break points. The first type enables you to setup the break point for a container, task or package. The second type will allow you to setup the breakpoint for the script task.
Breakpoint for an SSIS package
During execution, the package will be suspended based on the break condition. This will help us to investigate the issue at that point in time. SSIS provides ten break conditions that we can enable on tasks and containers. The breakpoints dialog box will help us set this up.
A breakpoint for a package can be setup as follows. Right click on the package and select "Edit Breakpoints..."

On the set breakpoint window, choose the relevant events to monitor. In the below picture, breakpoints have been setup for the package for OnPreExecute and OnError events. Click OK to save.
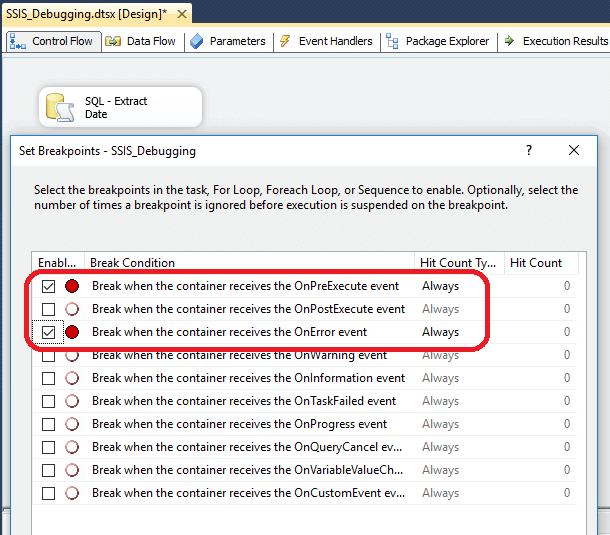
Notice the red dot in the control flow (this is an indication of package level breakpoints).

During execution, the control flow tab will be highlighted with a yellow arrow with a red background. This is an indication that SSDT is waiting for the user to respond. The breakpoint window will list the events available for debugging.

Breakpoints can also be modified (Added, Deleted and Modified) when the package is running.
Breakpoint for an SSIS container
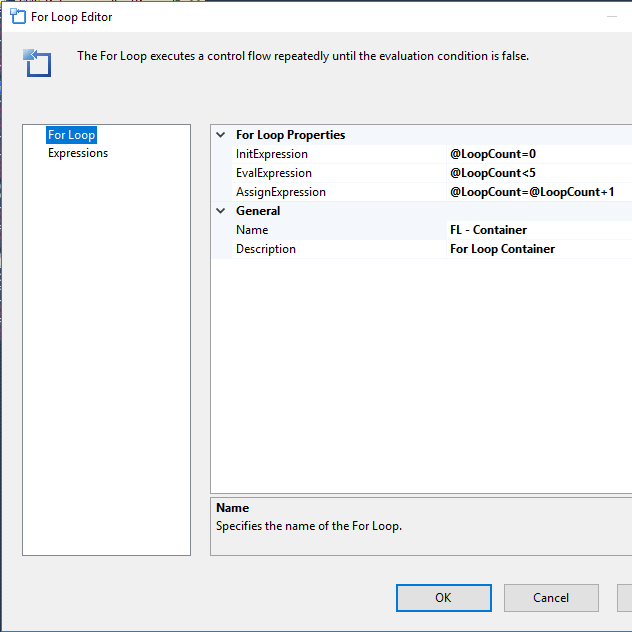
In the below example, we have created a "For Loop" container. A SQL task has been added to the "For Loop". The configuration details of the "For Loop" can be found in the picture below.
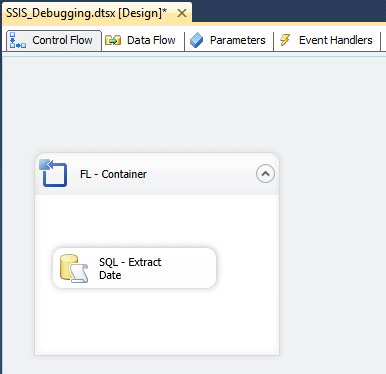
The "For Loop" will be executed for 5 iterations (value of the LoopCount variable - 0,1,2,3 & 4).
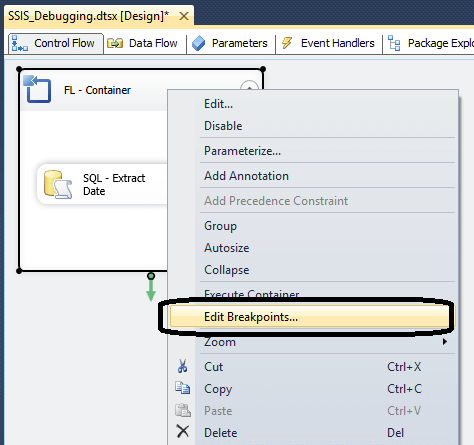
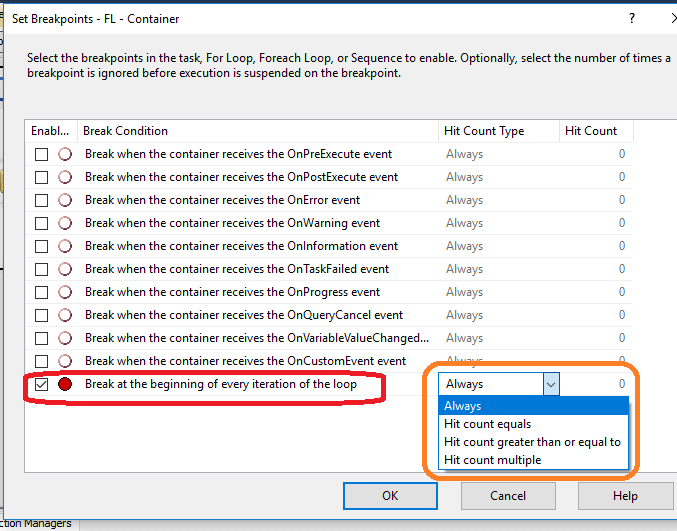
The breakpoint for the for the loop can be set by right clicking on the "For Loop" and editing breakpoints.
A special breakpoint condition "Break at the beginning of every iteration of loop" is available for the "For Loop". I have selected this breakpoint condition to break for every iteration of the "For Loop". The hit counter type has been set as "Always" (the default value).
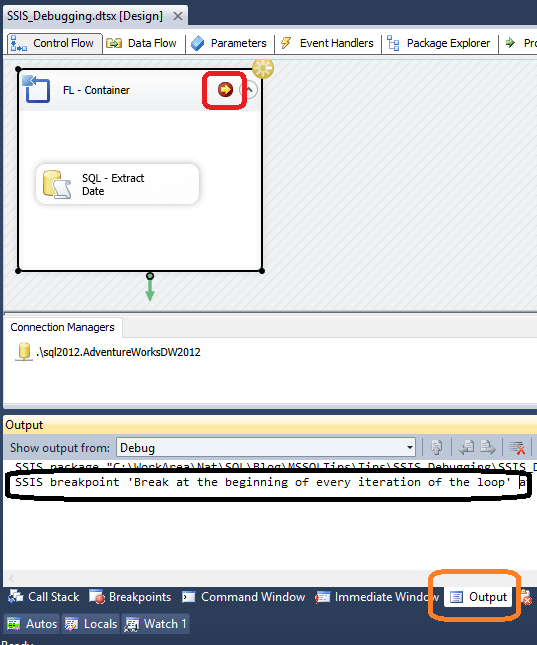
During execution the package will be suspended at the beginning of each iteration. The output window will be updated for each iteration. As this is the first iteration, the SQL task hasn’t been executed yet.
The below picture highlights the messages in the output window for the third
iteration.
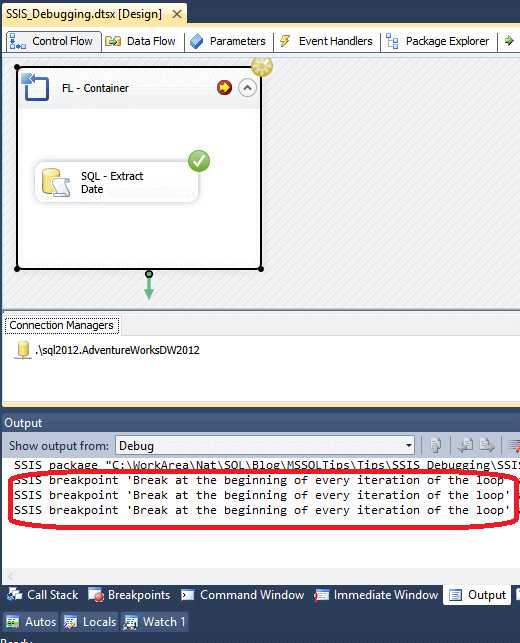
Now the SQL Task has been executed twice (for Iteration 1 and 2), hence the green
indicator is shown on the SQL task.
Progress tab in SQL Server Integration Services
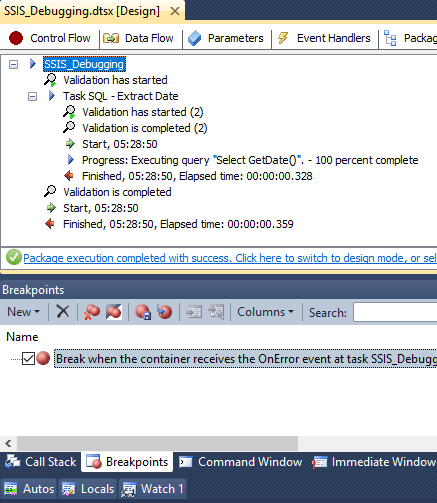
The SSDT designer lists information about tasks and containers in the progress tab. This includes start and finish times, warnings and error messages in order of execution. After the execution of the package, the progress information remains available on the Execution Results tab.
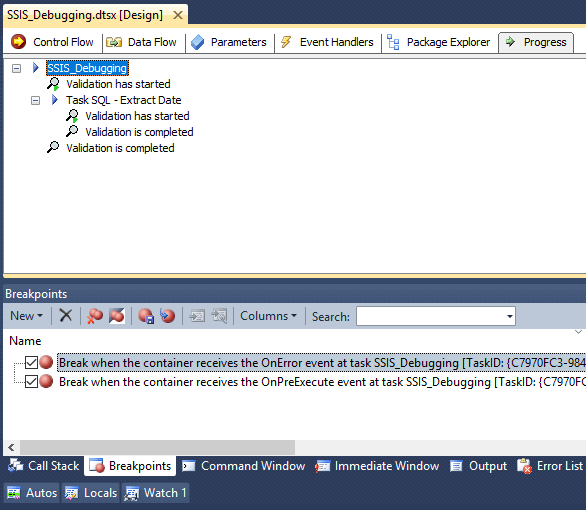
The progress tab will also highlight the status of debugging events. As per the picture below, the package has received a Pre-execute event. After the completion of debugging, the package can be continued (by pressing F5 or using the Continue button).
Summary
Breakpoints are one of the great debugging tools for SSIS. You will be able to master it by practicing with various examples. There are times they will help you identify issues with a few simple steps.
Next Steps
About the author
 Nat Sundar is working as an independent SQL BI consultant in the UK with a Bachelors Degree in Engineering.
This author pledges the content of this article is based on professional experience and not AI generated.
View all my tips
Article Last Updated: 2016-11-24


