By: Nat Sundar | Updated: 2016-12-06 | Comments | Related: More > Integration Services Development
Problem
In the last tip we learned about setting breakpoints for the SSIS package and the container. What other configuration options are there for debugging a SQL Server Integration Services (SSIS) package?
Solution
In this tip we will cover a few different methods to help with debugging a SSIS package.
Setting up break points in SSIS
The power of a breakpoint can be unleashed by defining a specific rule using the combination of Hit count and Hit count type.
A few examples to showcase the usage of custom breakpoints conditions are:
- Suspend the execution when the breakpoint hits a specific value (say 5th iteration)
- Suspend the execution when the breakpoint value is greater than or equal to a value
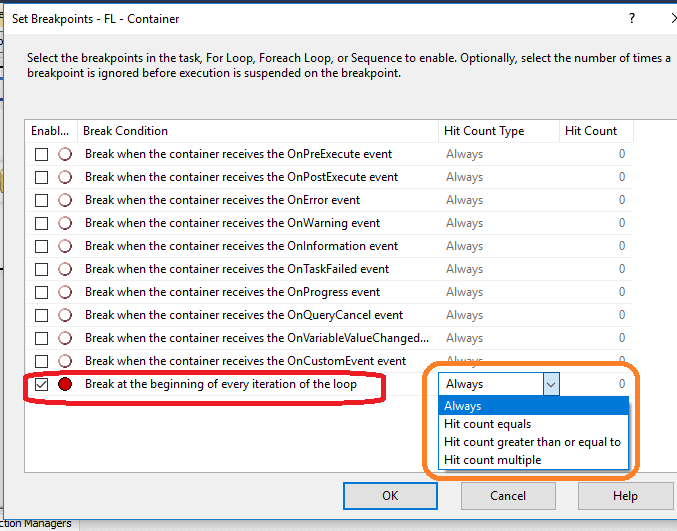
The Set Breakpoints dialog box can be used to define and to manipulate the break points. There are different options available for the Hit Counter Type.
- Always - When the breakpoint has been hit, the execution of the package will be suspended
- Hit count equals - Package execution will be suspended only if the breakpoint has occurred as many times as the hit count value
- Hit greater or equal - Same as the above and the breakpoint continue to hit if the number of iteration is greater than the hit count
- Hit count multiple - package execution will be suspended when a multiple of the hit count identified. (say 5,10,15,20th iterations)
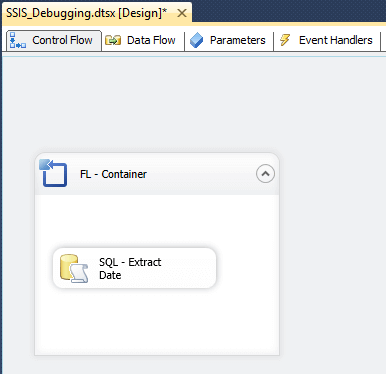
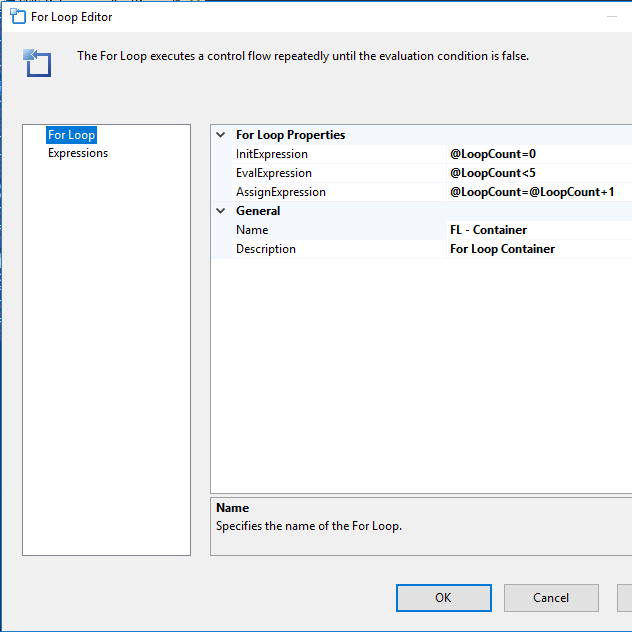
In the below example, we created a "For Loop" container. A SQL task has been added to the "For Loop". The configuration details of the "For Loop" can be found in the picture below.
The "For Loop" will be executed for 5 iterations (value for LoopCount variable - 0,1,2,3 & 4). The breakpoint for the for loop can be set by right clicking on the "For Loop" and editing the breakpoint.
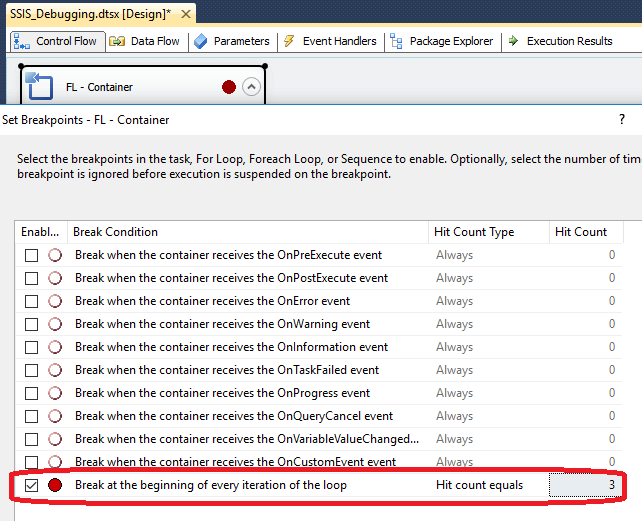
Now a custom breakpoint condition has been set as seen below. It has been set to suspend the execution when the iteration count reaches 3 (after the completion of iteration 2).
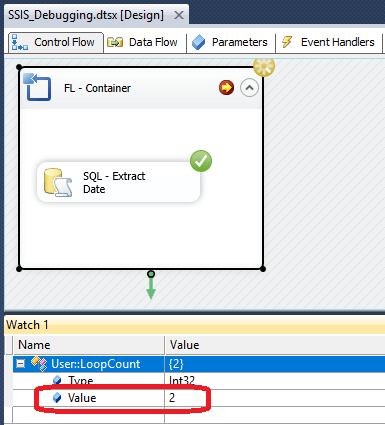
After the execution, the package has been suspended for iteration 3. The value of a variable can be monitored using the watch window as per the screen shot below.
SSIS Debug windows
The following windows in SQL Server Data Tools (SSDT) will be helpful to debug a package with breakpoints. These windows are usually visible at the bottom of the SSDT designer. If not visible, these windows can be activated using the menu Debug > Windows > Breakpoints.
- Breakpoints Window - List all the breakpoints and help to enable or disable the breakpoints
- Output Window - List all the messages associated with the breakpoint and other messages
- Immediate Window - This window can be used to print values of variables or expressions
- Watch Window - Displays information about the expressions
Usage of watch window in SSIS
In the below example the break condition "Break at the beginning of every iteration of the loop" and the Hit Count Type has been set to Always.
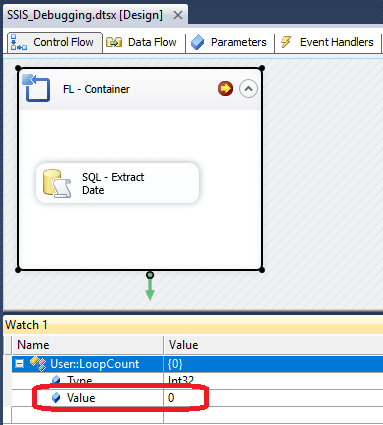
During execution, the package will be suspended at the beginning of each iteration. The LoopCount variable has been added to the watch window. In the first iteration, the value of the variable "LoopCount" can be seen as 0 in the watch window.
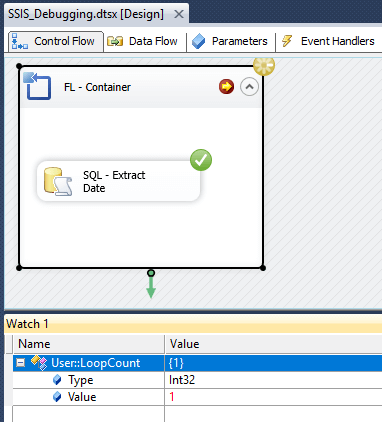
For the 2nd iteration, the value of the variable has been changed in the watch window to 1.
Breakpoints for SSIS script task
Breakpoints for script tasks can be defined in the Visual Studio Tools for Applications (VSTA). The breakpoints can be managed in the VSTA and it can be removed from the Set Breakpoints dialog box in SSDT designer. The Set Breakpoints dialog box lists the breakpoints in the script task. Usually these breakpoints will be listed at the bottom of the dialog box. In addition, this will list the line number and the name of the function (if set within a function).
During execution, the VSTA opens the script task in read-only mode. Once the breakpoint has been hit, the actual value of the variable can be analyzed. In the below example, a script task has been added to the control flow. Inside the script task, we derive the final value of the loopcount variable and concatenate with the string. The final string will be displayed using the messagebox.show function.
The value of the variable can be evaluated by setting a breakpoint inside the script task.
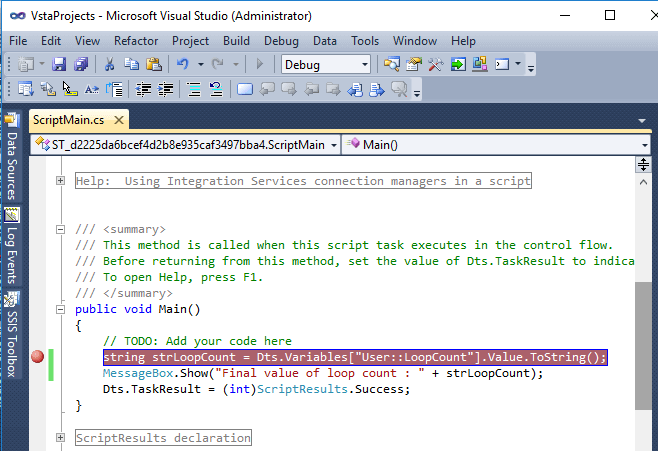
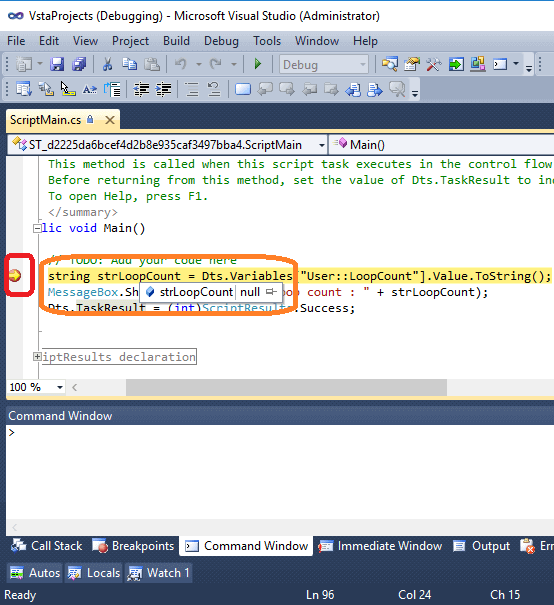
During execution, the line will be highlighted with a yellow arrow. If you move your cursor over the variable, you will see the value of the variable as "Null". Since the line has not been executed you don’t see a value.
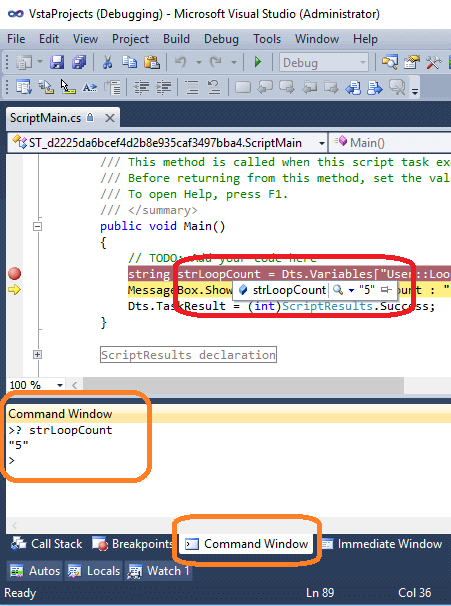
Once the line has been executed, if you move your cursor to the variable you will see the final value (5 in the picture below). In addition, the value of the variable or an expression can also be evaluated in the command window. You may start the expression with "?" and provide the variable or an expression to evaluate. The value will be evaluated and printed on the next line.
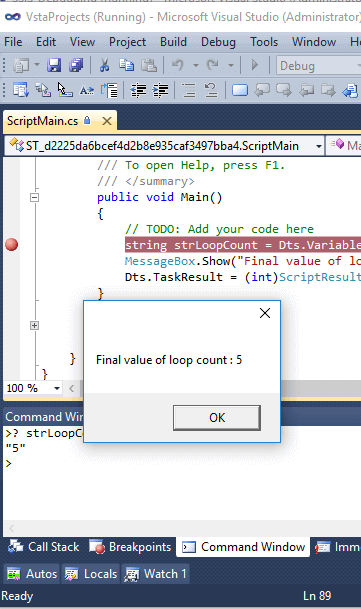
The final string will be prepared and displayed in the message box as shown below.
Points to remember
The whole package needs to be executed to debug a task or a container. The task/container breakpoints will be ignored if we are executing only the task/container.
The breakpoints of the script task from a child package will be ignored. The child package has to be executed directly, to debug a script task.
Breakpoint management
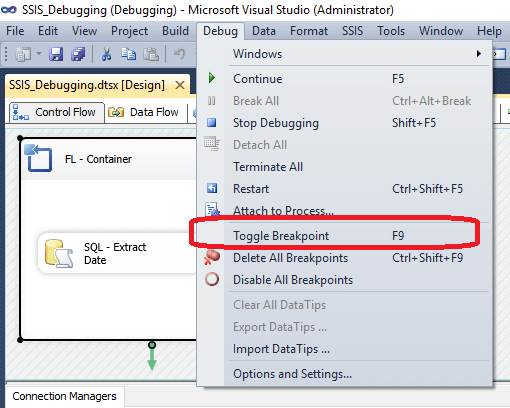
The breakpoints can be switched on /off (toggled) using the "Toggle Breakpoint" option in the Debug menu. After the completion of debugging, all the breakpoints can be deleted.
Summary
In the "SSIS Debugging" tips, we learned various techniques to debug a SSIS package. These tools and techniques will help you to reduce the time to develop SSIS solutions. Also this will help to investigate and fix issues quickly.
Next Steps
- Read the first part of this series
- Read more about "How to debug a package" here
- Read about "Debugging Control Flow" here
About the author
 Nat Sundar is working as an independent SQL BI consultant in the UK with a Bachelors Degree in Engineering.
This author pledges the content of this article is based on professional experience and not AI generated.
View all my tips
Article Last Updated: 2016-12-06


