By: Ahmad Yaseen | Updated: 2017-01-11 | Comments | Related: > Performance Tuning
Problem
SQL Server Trace Flags are used mainly to switch on or off a specific set of behaviors globally at the instance level or locally at the session level. Trace flags can be used to diagnose performance issues or change the behavior of queries. The DBCC TRACESTATUS command can be used to list all trace flags that are enabled at all levels. Is there a way to get trace flag information from the query plan?
Solution
Starting with SQL Server 2014 SP2 and including SQL Server 2016 SP1, trace flag information can be reviewed in the TraceFlags section of the query XML execution plan, where all trace flags that are enabled at the time the query is compiled and executed at the instance and session levels will be listed.
Running the DBCC TRACESTATUS command will show us all enabled trace flags both globally at the instance level and locally at the session level, with the trace flag status:
DBCC TRACESTATUS;
GO
The result in our case shows us that the only enabled trace flag globally at the instance level is trace flag 4199:

If we execute the below SELECT statement:
USE MSSQLTipsDemo
GO
SELECT TOP 1000 [CountyCode],[RowVersion]
FROM [MSSQLTipsDemo].[dbo].[CountryInfoNew]
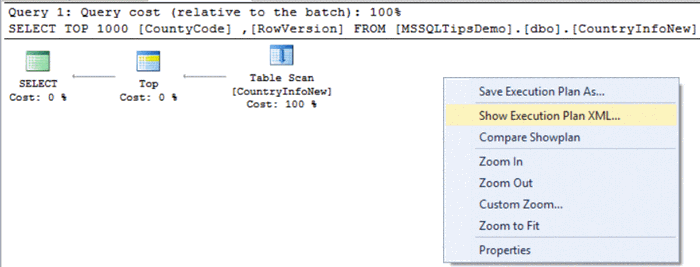
Then from the execution plan for that query, right-click on the SELECT operator and choose Properties:

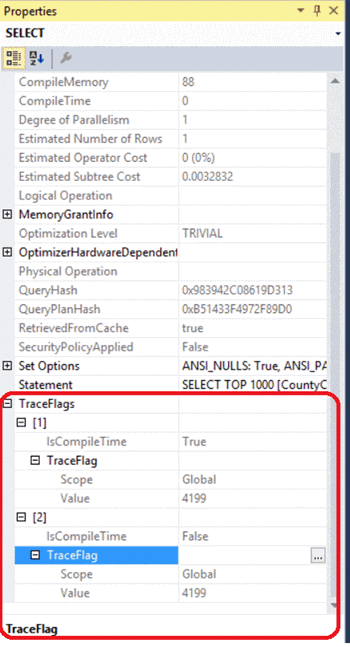
The SELECT operator’s properties window contains a separate node for the TraceFlags that show us all trace flags that are enabled with the scope (globally or locally) at both compile time with the IsCompileTime value equal to true and at the run time with the IsCompileTime value equal to false:

The same information can be found in the queries in the XML execution plan. Right-click on the graphical execution plan and choose Show Execution Plan XML:

There is now a section in the XML execution plan, TraceFlags, in which we can see all enabled trace flags and the scope for the trace flags, globally at the instance level or locally at the session level both at compile time with IsCompileTime value equal to true and at run time with IsCompileTime value equal to false.
The below result shows us that only trace flag 4199 was enabled globally at the instance level both at compilation and runtime:

If we modify the previous query and enable trace flag 1118 at the session level using the QUERYTRACEON option:
USE MSSQLTipsDemo
GO
SELECT TOP 1000 [CountyCode],[RowVersion]
FROM [MSSQLTipsDemo].[dbo].[CountryInfoNew]
OPTION (QUERYTRACEON 1118);
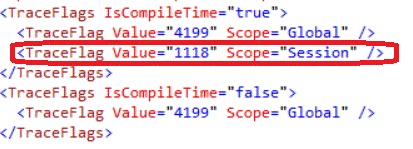
The generated XML execution plan will show us trace flag 1118 is enabled at compilation time at the session scope as shown below:

Take into consideration that if there is no trace flag enabled at the instance or session levels at the compilation or execution time, there will not be a section for the TraceFlags in the queries XML execution plan.
Next Steps
- Read more about Enabling SQL Server Trace Flag for a Poor Performing Query Using QUERYTRACEON.
- Check out Query Execution Plans.
- Check also New Features in SQL Server 2016 Service Pack 1.
About the author
 Ahmad Yaseen is a SQL Server DBA with a bachelor’s degree in computer engineering as well as .NET development experience.
This author pledges the content of this article is based on professional experience and not AI generated.
View all my tips
Article Last Updated: 2017-01-11


