By: Nat Sundar | Updated: 2017-07-24 | Comments | Related: 1 | 2 | 3 | 4 | > Power BI
Problem
I read the previous tips about developing a Personal Finance calculator in Power BI tip #1 and tip #2. How can I analyze expenses when compared with the actual budget? Also, how can I see the expense trend over a period of time?
Solution
To continue with our previous tips about building a Personal Finance Calculator with Power BI, in this tip I will extend the model to include budget analysis. In addition, I will also walk-through the steps to load more data to analyze the expense trend.
Prerequisite
It is recommended to read the previous tips tip #1 & tip#2 to develop the Personal Finance Calculator, since we are building on top of that solution.
Source Data for Budget
Let’s assume we have budget data in the form of an Excel workbook as shown below. This workbook has only two columns Month and BudgetAmount.
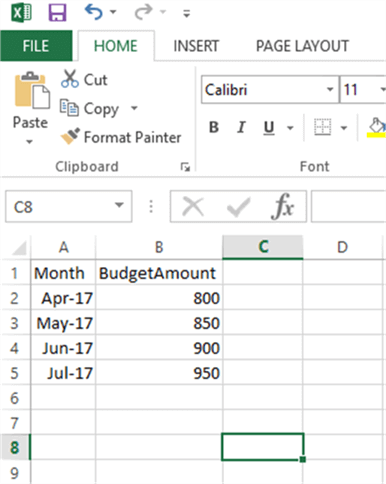
This budget Excel workbook can be loaded into the Power BI model using “Get Data” > Excel functionality.
The below image represents the budget workbook imported into the Power BI model. The column names have been defined in the first row and the Power BI model has recognized the columns dynamically.
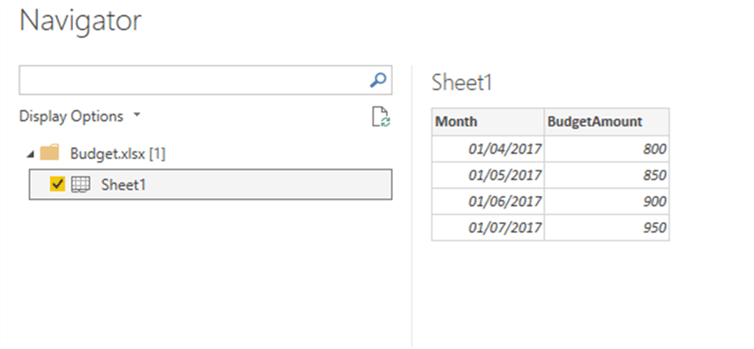
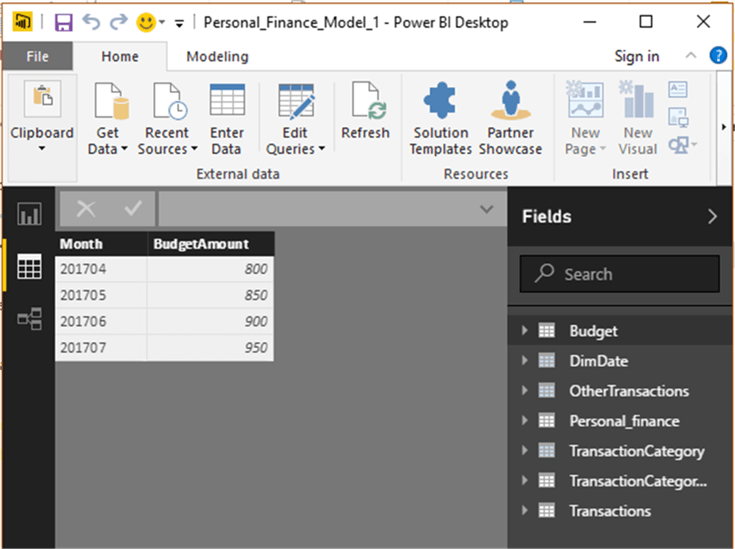
Now we can see that a table “Budget” has been created in the Power BI model.
Loading multiple months of transactions
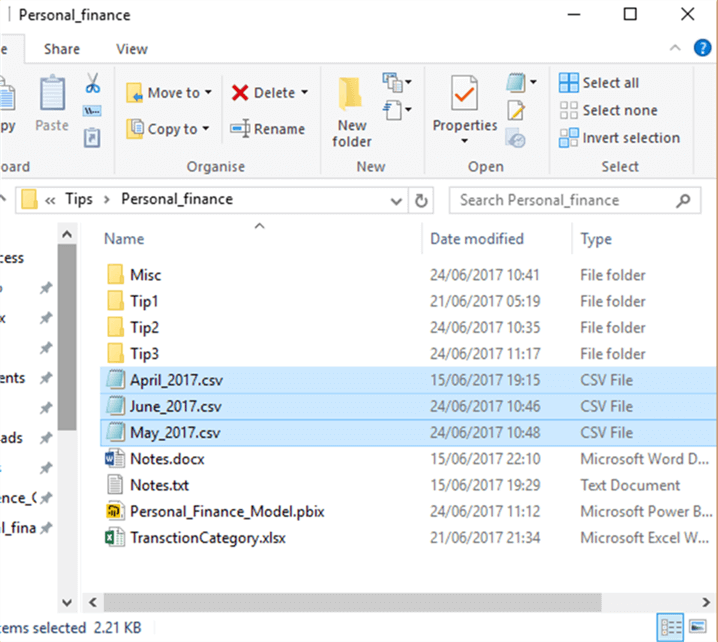
The previous tip had only one month of transactions for the expense analysis. As we have budget data for 3 months, this is the ideal time to extend the model to include transactions for more months.
Let’s assume we have 3 months of transactions in the form of CSV files for each month. These transaction files have been highlighted in the below image.
Loading files from a folder
Power BI has an option to load multiple files from a folder. This is achieved by navigating “Get-Data” > More option.
Now on the dialog box, select the “Folder” option.
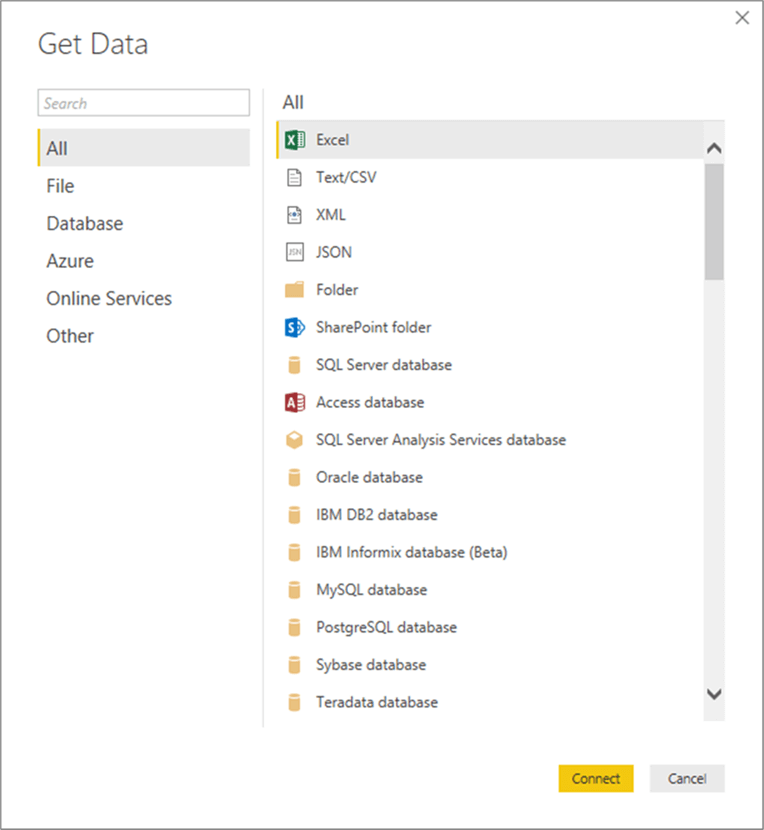
On the folder dialog box provide the name of the folder as shown below.

Now Power BI has identified the available files in the folder.
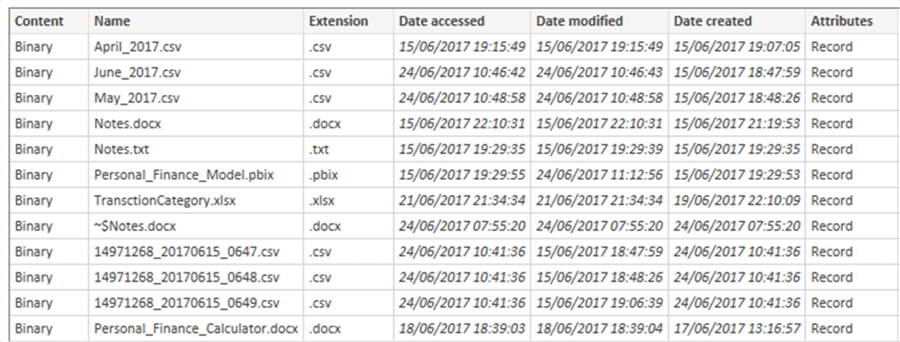
As the transaction files are in a CSV format, we can apply the filter to select only CSV files. This has been represented in the image below.
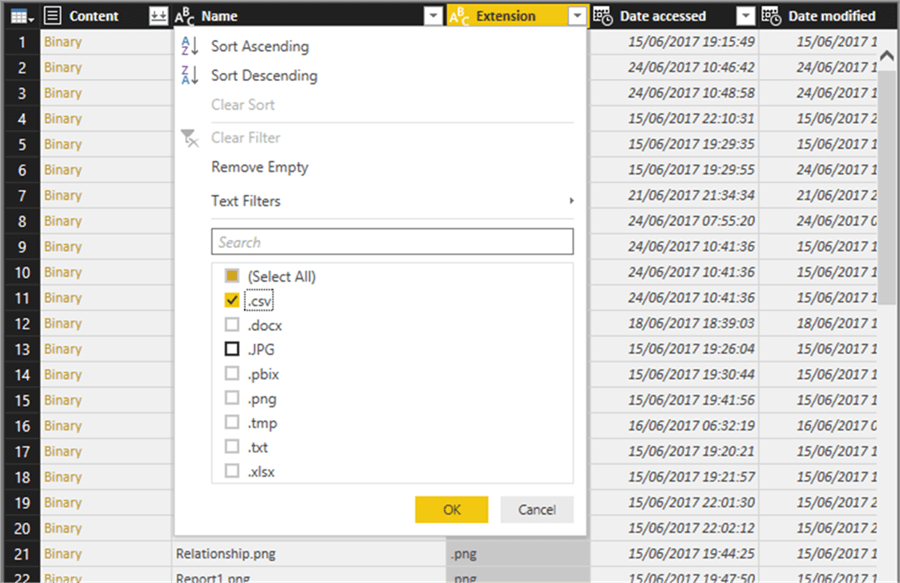
Once we applied the filter, Power BI will list the monthly transaction files.

As we are not interested in other columns, we can remove other columns as per the image below.
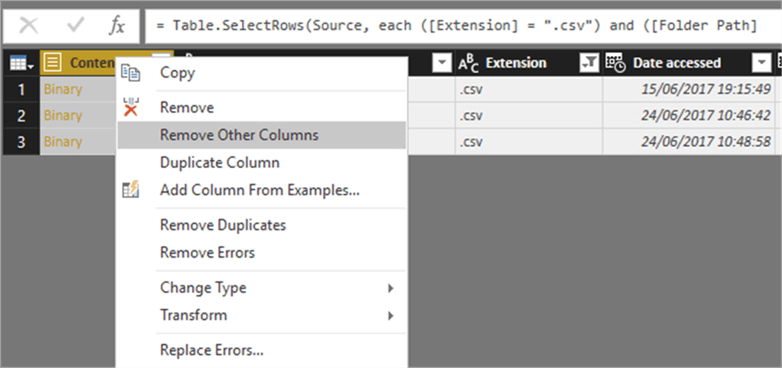
Now we can preview the data as below.
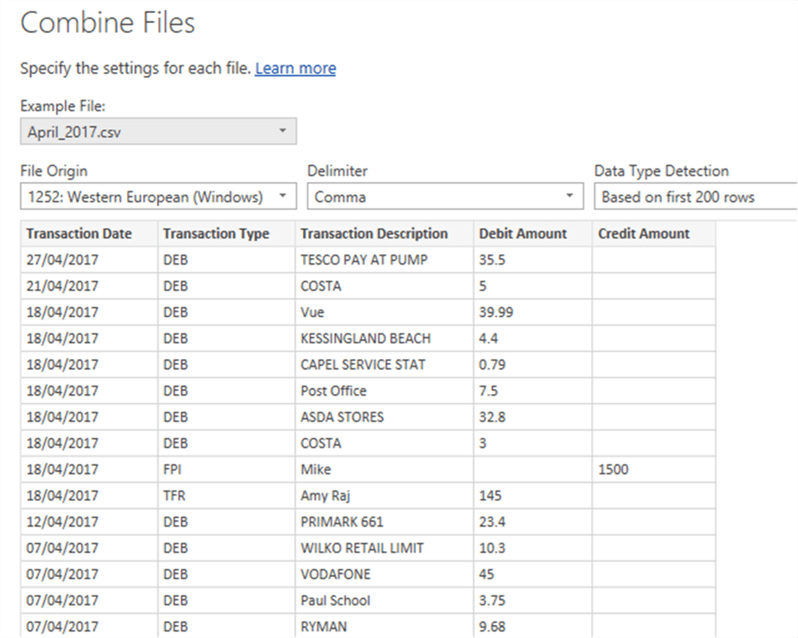
The newly created query can be seen with transactions for many months as shown below.
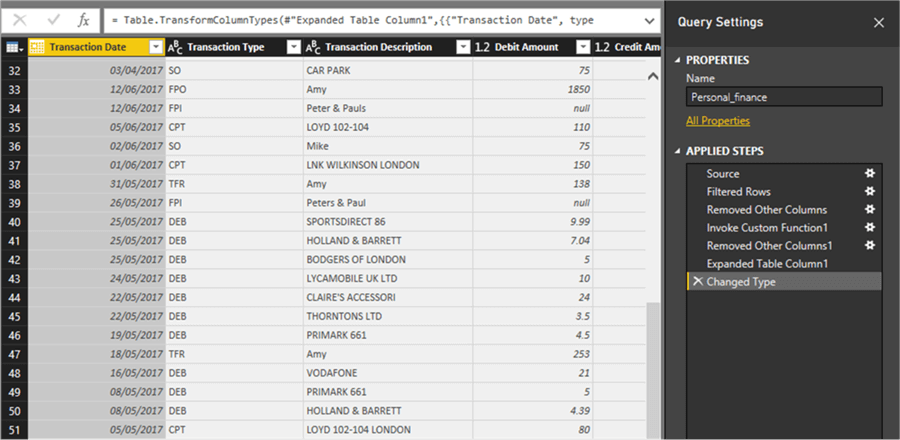
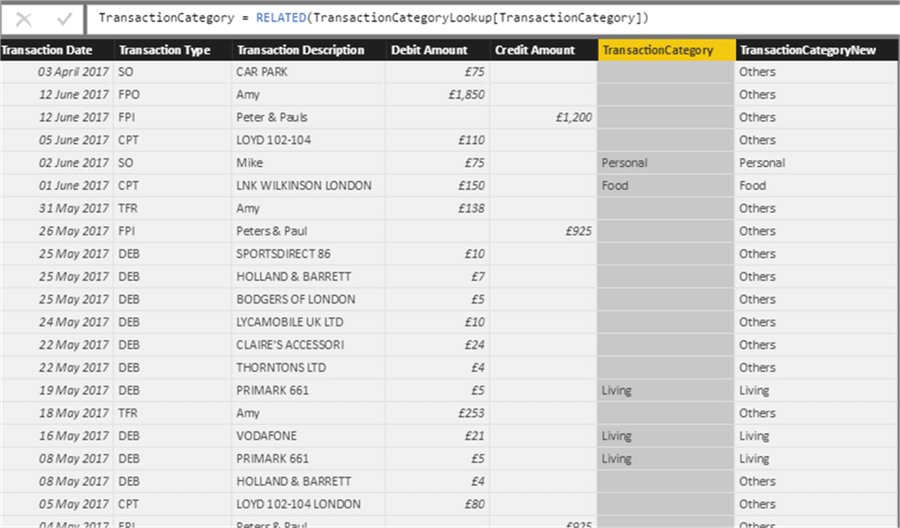
Now close and apply to create the table in Power BI. The below image represents the newly created table in Power BI.
Let’s refresh the previously created Dashboard to see the results.
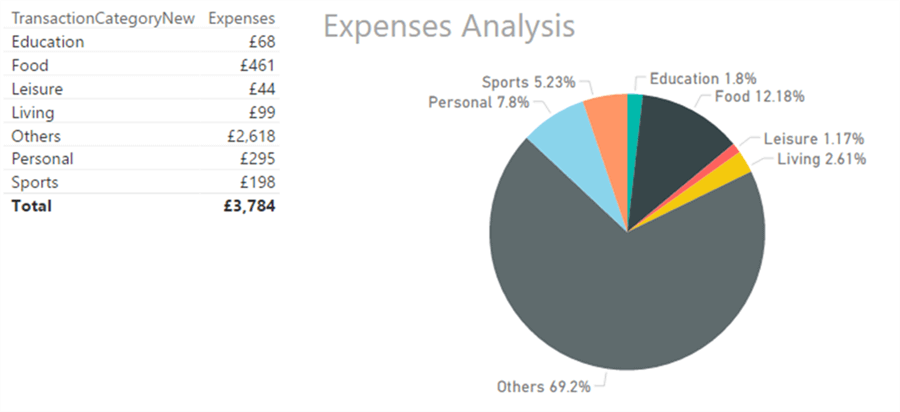

From the above reports, it is confirmed that the transactions for all the months have been consolidated. However it would be useful to analyze the expense on monthly basis. Now let’s add a filter on the ReportMonthYear column.
The below image represents the expense analysis for the month of May.
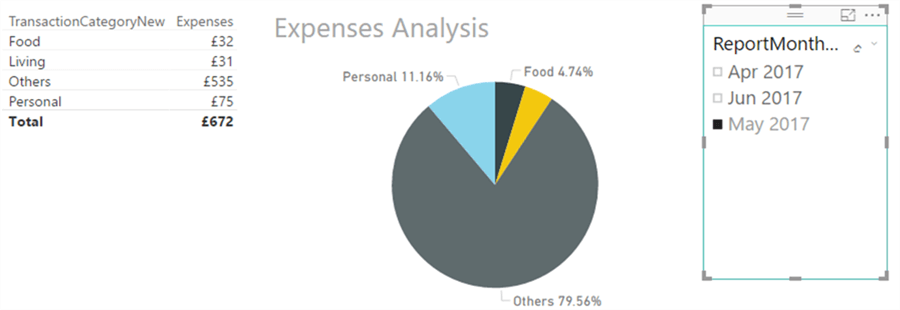
However we have realized that 80 % of expenses are classified as Others, as there is no category defined for those transactions.
Identifying the transactions without transaction category
The TransactionCategoryLookup table has the definition for transaction categories for known transaction descriptions. On the other hand the Transactions table has all mapped and unmapped transactions. The transaction table represent a super set. The transactions without a valid transaction category can be found using the below DAX expression.
OtherTransactions = Except(Distinct(Transactions[Transaction Description]),
DISTINCT(TransactionCategoryLookup[TransactionDescription]))
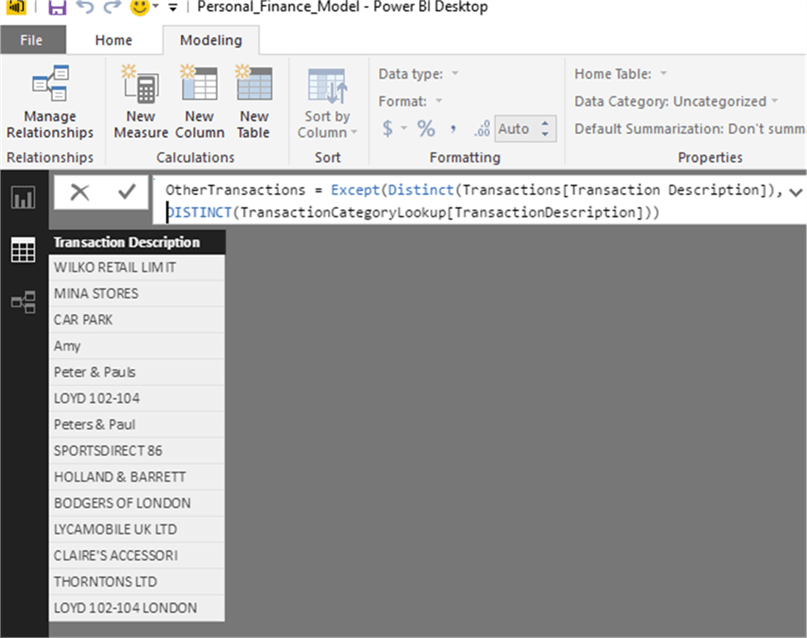
Now we can copy these transactions and add them to the Transaction Category lookup file to define the category.
The below image represents the updated transaction category lookup file.
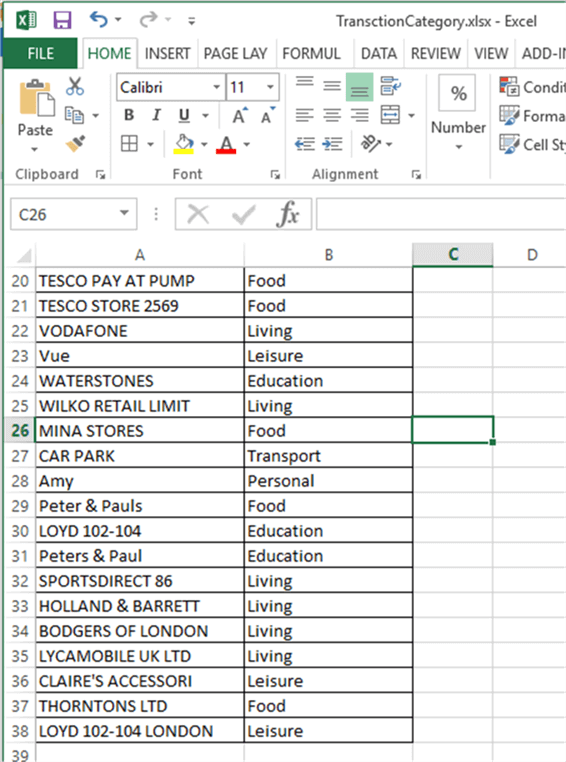
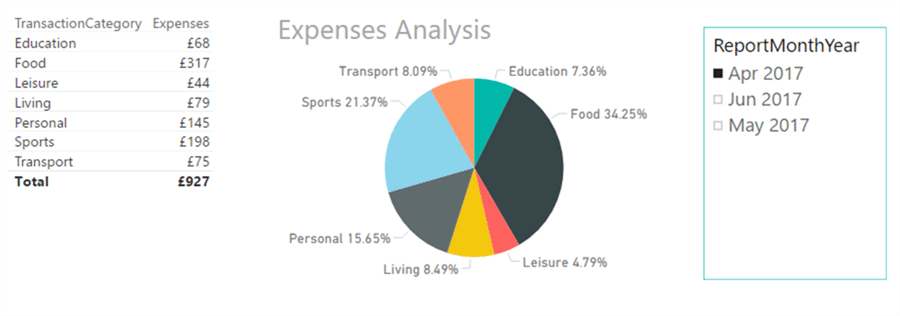
Now the expense report can be refreshed for the reporting month. Now there are no transactions in the Others category.
Budget versus Expense Analysis
I have added a calculated column “MonthNumber” to enable us to do a lookup against the Budget Amount.
The below DAX expression has been used to derive the Month Number.
MonthNumber = FORMAT(Transactions[Transaction Date],"YYYYMM")
The below image represents the addition of the new column “MonthNumber”.
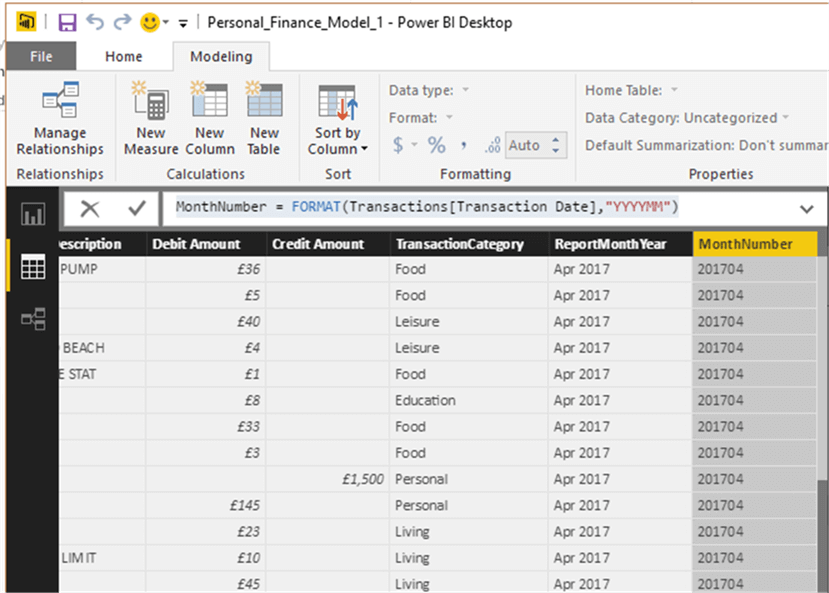
The budget has been defined at the monthly level. However the actual transactions are based on the daily level. We need to add a column in the Transaction table to do the lookup and calculate the monthly budget amount.
As the granularity is different between the transaction and the budget table, we will not be able to use the related function for the lookup. So to lookup and calculate the budget based on the Report month, I am using the below DAX expression.
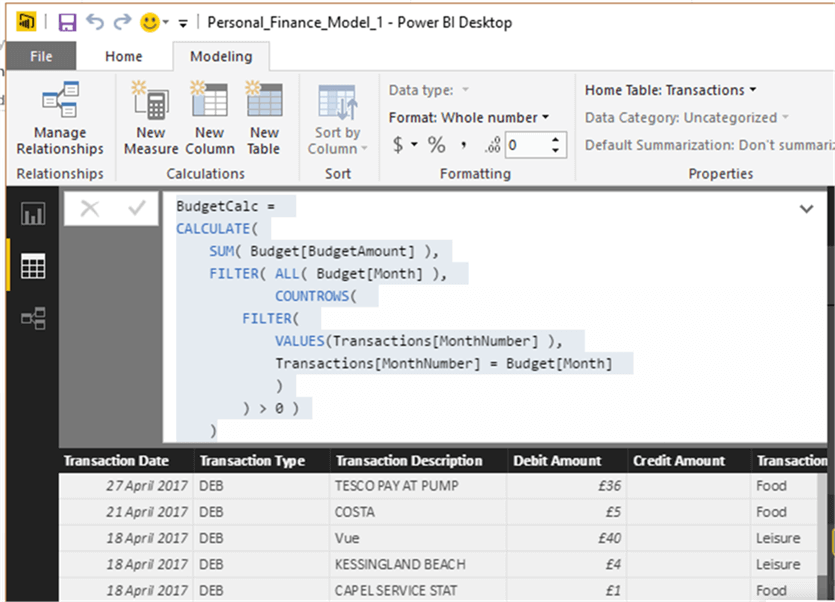
A new measure BudgetCalc has been added in the transactions table for the purpose of calculating budget.
BudgetCalc =
CALCULATE(
    SUM( Budget[BudgetAmount] ),
    FILTER( ALL( Budget[Month] ),
            COUNTROWS(
      FILTER(
         VALUES(Transactions[MonthNumber] ),
         Transactions[MonthNumber] = Budget[Month]
         )
      ) > 0 )
   )
The below image confirms the creation of the new measure.
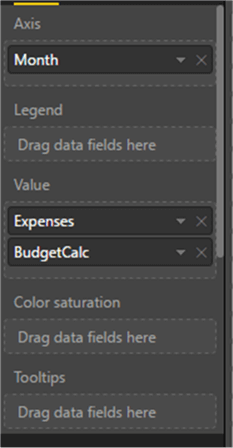
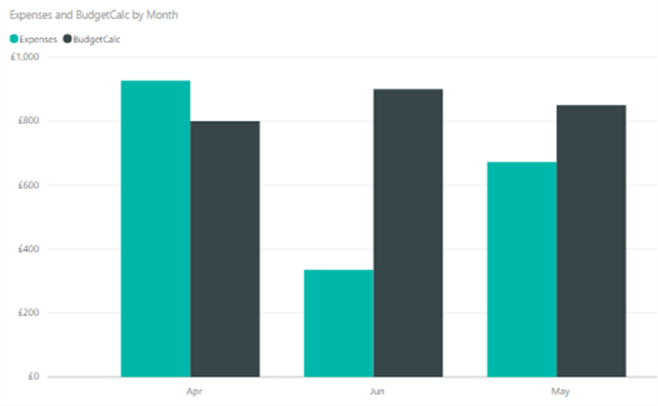
A clustered column chart has been developed with Month in the X-Axis and Expense and Budget Amount in the Y axis.
The below image represents the configuration for the clustered column chart.
The below image shows expenses are below the budget limit for months of June and May, however it expenses were beyond the budget limit for April.
Summary
In this tip, we have enhanced the Power BI model to analyze expenses in comparison with the monthly budget amount.
Next Steps
- Stay tuned to read the next tip to analyze personal finance from multiple personal accounts.
- Read more about the Summarize function.
- Read other Power BI Tips here.
Learn more about Power BI in this 3 hour training course.
About the author
 Nat Sundar is working as an independent SQL BI consultant in the UK with a Bachelors Degree in Engineering.
This author pledges the content of this article is based on professional experience and not AI generated.
View all my tips
Article Last Updated: 2017-07-24


