By: Aaron Bertrand | Updated: 2017-07-25 | Comments | Related: > Monitoring
Problem
Since the early days of SQL Server, it has always been important to monitor virtual log files (VLFs). Too many VLFs and/or VLFs that are too large can hurt transaction log throughput and create severe bottlenecks for startup, backup and restore operations, and to some extent this can affect mirroring, log shipping, replication, and availability groups as well.
In current versions of SQL Server, you must use DBCC LOGINFO, DBCC SQLPERF(LOGSPACE), catalog views, and performance counters to stay current on the health of your transaction log and the VLFs inside. I’m going to focus on DBCC LOGINFO here – this command returns a list of all the VLFs in the current database, but it has several problems:
It is undocumented, and therefore unsupported. So, if you’re using this function, and it runs slowly, returns the wrong results, or causes other problems, you’re on your own. Microsoft is likely to simply tell you to stop using undocumented DBCC commands.
It requires elevated privileges. While there may be some obscure workarounds, usually the easy way out is to just grant sysadmin to all of the users or applications that need to review this information.
The output can’t be used in a set-based query. Often you will want to combine the VLF information from this command with other data using join or apply (such as file sizes, autogrowth configuration, and other values you can obtain from catalog views and DMVs). For DBCC commands like this, you need to pre-create a #temp table and use dynamic SQL to insert/exec.
Solution
SQL Server 2017 adds new dynamic management functions (DMFs) that allow you to keep better tabs on the contents of your transaction log files (and they work on both Windows and Linux). To start, using a copy of SQL Server 2017 RC1, I created the following database (with two log files, to provide an edge case):
CREATE DATABASE twologs;
GO
ALTER DATABASE twologs ADD LOG FILE
(
    NAME = N'twologs_logtwo',
    FILENAME = N'C:\...path...\twologs_logtwo.ldf',
    SIZE = 8192KB,
    FILEGROWTH = 65536KB
);
The new DMFs take database_id as an argument, so they can easily be used as the target of an apply query.
sys.dm_db_log_stats (database_id)
This function (documentation here) returns a row for each database (even if you have multiple log files, which you shouldn’t). The output includes the database_id (since you can pass NULL or DEFAULT and get info for all databases), VLF counts, VLF size, LSNs, information about recovery model (this matches sys.databases.recovery_model_desc), a column that shows why log truncation can’t happen (this matches sys.databases.log_reuse_wait_desc), and a host of other information. Some of this info is obviously redundant with sys.databases, but repeating it can avoid messier joins in some cases.
Running the following query against the database I just created:
SELECT * FROM sys.dm_db_log_stats(DB_ID(N'twologs'));
Here is the output (I had to break it out into multiple rows):

sys.dm_db_log_info (database_id)
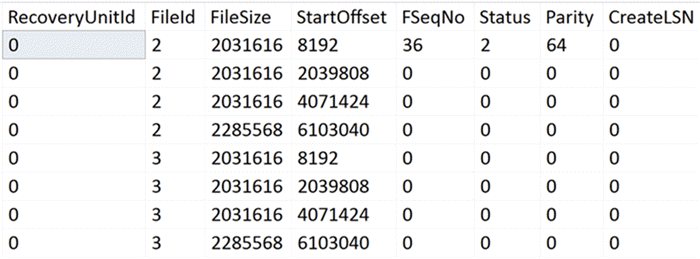
This function (documentation here) returns a row for each virtual log file, just like DBCC LOGINFO. In this case I happen to have 8 VLFs – 4 in each of the two log files I created. The output we get is close, but slightly different – let’s compare:
DBCC LOGINFO(N'twologs');

SELECT * FROM sys.dm_db_log_info(DB_ID(N'twologs'));

You can see that the new DMF provides additional information about LSMs and active VLFs, but is missing RecoveryUnitID, which was added to the DBCC command in SQL Server 2012. I’ll happily confess that I don’t know what this column truly represents, aside from that it has something to do with log pool management.
More Practical Example
You can get summary VLF info for all databases with a query like this:
SELECT
  [database]      = d.name,
  [recovery]      = ls.recovery_model,
  [vlf_count]     = ls.total_vlf_count,
  [active_vlfs]   = ls.active_vlf_count,
  [vlf_size]      = ls.current_vlf_size_mb,
  [active_log_%]  = CONVERT(decimal(5,2),
                    100.0*ls.active_log_size_mb/ls.total_log_size_mb)
FROM sys.databases AS d
CROSS APPLY sys.dm_db_log_stats(d.database_id) AS ls;
Output:

You could filter down to only those databases with more than n VLFs with a simple WHERE clause, like:
WHERE ls.total_vlf_count > n;
That is much easier than looping through all your databases, inserting DBCC LOGINFO output into a #temp table, then counting the rows for each database. And the best part is, these functions only require VIEW DATABASE STATE permissions, meaning you will have a much easier time getting this info to the right people, without having to give them all sysadmin.
Next Steps
SQL Server 2017 allows you to collect information about VLFs in a much more convenient way than in the past. You can play with these functions by downloading a pre-release evaluation, but most of us will have to wait until later this year to enjoy these new functions in production. In the meantime, you can read up on the following tips and other resources to get a better understanding of why proper VLF management can be so important:
- What is a Virtual Log File (VLF)?
- Monitoring SQL Server database transaction log space
- How to determine SQL Server database transaction log usage
- Monitor Your SQL Server Virtual Log Files with Policy Based Management
- Using PowerShell To Record SQL Server Virtual Log File (VLF) Growth
- Performance Issue with large number of Virtual Log Files in SQL Server Transaction Log
- Transaction Log VLFs – too many or too few?
- 8 Steps to better transaction log throughput
- A Busy/Accidental DBA’s Guide to Managing VLFs
About the author
 Aaron Bertrand (@AaronBertrand) is a passionate technologist with industry experience dating back to Classic ASP and SQL Server 6.5. He is editor-in-chief of the performance-related blog, SQLPerformance.com, and also blogs at sqlblog.org.
This author pledges the content of this article is based on professional experience and not AI generated.
View all my tips
Article Last Updated: 2017-07-25


