By: Ben Snaidero | Updated: 2018-02-26 | Comments (1) | Related: > Monitoring
Problem
Of all the tasks a SQL Server Database Administrator has to perform, while it can sometimes be quite stressful, troubleshooting performance issues is one of the things I find most enjoyable about the job. You usually have to put on your detective hat and take all the clues that you are given. It could be information from users, monitoring tools or other information you've gathered yourself and use this data to pinpoint the root cause of the issue.
In this tip we will go through a checklist which will help you to check OS level performance which should help to point you in the right direction to find any performance issues that exist in your SQL Server instance.
Solution
Before using this checklist to actually try to diagnose a SQL Server performance issue it is usually a good idea to run through all of the items and get a baseline of your system when it's performing well. Doing this will make it easier for you to pinpoint any issues as all you have to do is look for any deviation from your baseline. For example, if you know that your system usually has about 20% disk time and after you run through the checklist you see that it is running at 50% you know right away that some process is reading and/or writing more data than normal. Similarly, if you see that your system is executing more queries than normal you know you might have a process running that usually does not run or shouldn't be running in your production SQL Server instance. Maybe it should be running in some other reporting environment.
There are many different tools for collecting performance metrics on a Windows system. There are GUI based tools like Performance Monitor, Resource Monitor, Task Manager or the SysInternals suite of utilities. I prefer to use PowerShell to gather performance counters as it makes it easier to run on whatever server(s) I need to run it against from a central server and can also be scheduled and the output saved to a file for later analysis. Below I'll go through a complete system health check using windows performance counters which will be broken down into a few different sections: CPU, Memory, IO, Network, Disk Space, SQL Server.
CPU
Usually the most telling performance metric and the one I usually check first to verify the health of a system is the CPU usage on the server. Even if the root cause of the performance issue due to some other issue (IO, network, etc...) the CPU will most definitely be affected as well and will show higher than normal. To check this we can use the % Processor Time performance counter (1).
(1) Get-Counter '\Processor(*)\% Processor Time'

Memory
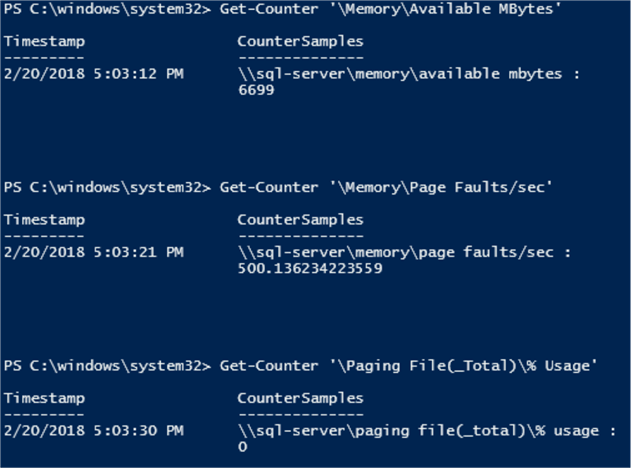
A little less important since you can set/limit the amount of memory that SQL Server will consume and in most production systems SQL Server will be the only application running on the server, but never the less you should check that you are not running out of system memory or paging excessively. Below are a few counters you can use to check the amount of memory available memory (2), number of page faults per second (3) and percent of the page file that is used (4).
(2) Get-Counter '\Memory\Available MBytes'
(3) Get-Counter '\Memory\Page Faults/sec'
(4) Get-Counter '\Paging File(_Total)\% Usage'

IO
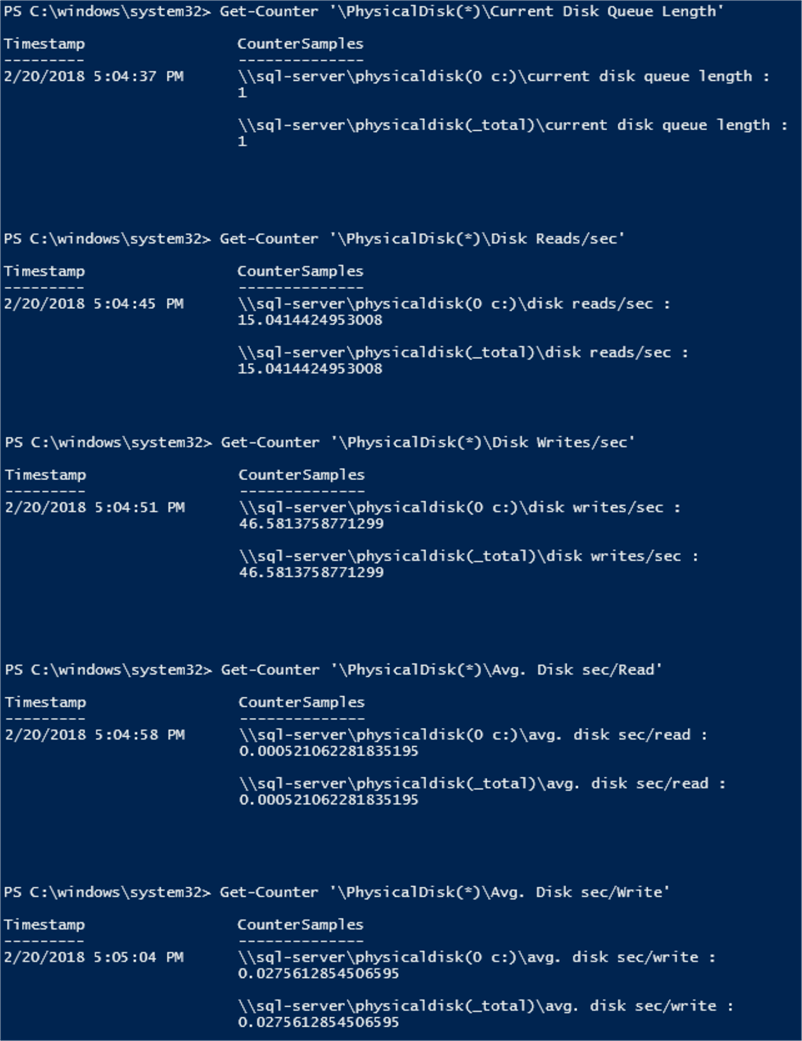
Checking the IO on the server is also very important. Increases in these counters can point to issues with your storage subsystem (5, 7) or that your hardware might not be capable of handling the load that your SQL Server instance is putting on it (5, 6). It can also be an indicator that there are missing indexes and queries are doing full table scans (6).
(5) Get-Counter '\PhysicalDisk(*)\Current Disk Queue Length'
(6) Get-Counter '\PhysicalDisk(*)\Disk Reads/sec'
(6) Get-Counter '\PhysicalDisk(*)\Disk Writes/sec'
(7) Get-Counter '\PhysicalDisk(*)\Avg. Disk sec/Read'
(7) Get-Counter '\PhysicalDisk(*)\Avg. Disk sec/Write'

Network
Checking if the network is healthy is one of the more straightforward issues to diagnose. If a process is sending or receiving more data than normal you will see it with these counters (8).
(8) Get-Counter '\Network Interface(*)\Bytes Sent/sec'
(8) Get-Counter '\Network Interface(*)\Bytes Received/sec'

Disk Space
Definitely the easiest issue to diagnose and fix, but one that should always be checked none the less is to monitor the percent of free disk space (9) for each drive in your system. Running out of space will mean that data files will no longer be able to extend, if needed. Also, any sorts that require temp space might not be able to complete.
(9) Get-Counter '\LogicalDisk(*)\% Free Space'

SQL Server
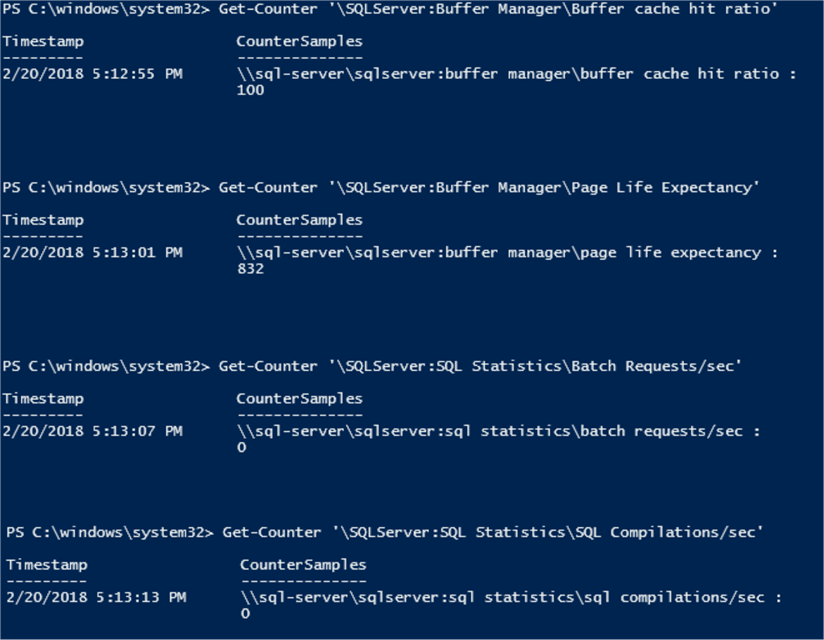
This last set of counters while not really OS related still help to give a high-level look into the health of your SQL Server instance. The buffer cache hit ratio (10) will tell you the percentage of reads that were found in memory and did not need to be read from disk. The page life expectancy (10) gives you an idea of the number of seconds a page will stay in memory (without being referenced). Both of these counters help to determine if the memory on your server is being utilized efficiently. The batch requests/sec (11) counter tells you how many queries your system is processing per second and is a great way to measure the load on your SQL Server instance. SQL compilations/sec (12) gives you an idea of how the plan cache is performing. If this number is high your CPU can become busier having to constantly compile explain plans for new queries.
(10) Get-Counter '\SQLServer:Buffer Manager\Buffer cache hit ratio'
(10) Get-Counter '\SQLServer:Buffer Manager\Page Life Expectancy'
(11) Get-Counter '\SQLServer:SQL Statistics\Batch Requests/sec'
(12) Get-Counter '\SQLServer:SQL Statistics\SQL Compilations/sec'

And there you have it. A straightforward script you can run using PowerShell that will give you a good overview of the health of you SQL Server instance. Remember you should run this or something similar when the server is performing well in order to have a baseline to compare against when you run into issues.
Next Steps
- Read other tips on monitoring
- Read other tips on PowerShell
- Look for a future tip on checks that can be performed within your SQL Server instance to help find performance issues
About the author
 Ben Snaidero has been a SQL Server and Oracle DBA for over 10 years and focuses on performance tuning.
This author pledges the content of this article is based on professional experience and not AI generated.
View all my tips
Article Last Updated: 2018-02-26


