By: Aaron Bertrand | Updated: 2017-12-18 | Comments (1) | Related: > Performance Tuning
Problem
In many OLTP systems, parallelism is only truly useful on a subset of queries. Most of the typical workload is comprised of quick queries that affect a small number of rows and, in turn, consume very little in terms of resources. When queries do end up using parallelism, the end result can range from mildly beneficial, to downright disastrous, depending on a variety of factors.
Now, when parallelism is working well, work is distributed evenly across all of the “producer” threads, and they all finish around the same time, handing their results off to the “consumer” threads. While the consumer threads (and the controller thread) are waiting for all of the producers to finish, CXPACKET waits are accumulating (the “good” kind). When parallelism is not working well, for example when one producer thread is doing most of the work because of poor estimates, the producer threads that have finished their work sit around and wait, also accumulating CXPACKET waits (the “bad” kind). So in both of these scenarios – whether the query employs “good” or “bad” use of parallelism – SQL Server surfaces wait statistics in the same way: using the dreaded CXPACKET wait.
As you can imagine, and probably already know, this makes troubleshooting “bad” parallelism very hard, because all queries are reporting CXPACKET waits. In most cases, this simply indicates that parallelism is happening, which is usually a good thing. But because there are cases where we see skewed parallelism, you get all kinds of knee-jerk reactions to a system with high CXPACKET waits. The most common is to turn off parallelism at the server level (server MAXDOP = 1), and this is often deemed successful because, hey, look at our waits, we no longer see CXPACKET at the top. Often this just means two things: (1) the queries that were making good use of parallelism are now taking at least as long, and possibly longer; and (2) those waits are just surfacing in other places.
Solution
In SQL Server 2016 SP2, SQL Server 2017 CU3, and Azure SQL Database, you are going to see a huge change in the way CXPACKET waits are reported. The “bad” type of wait, where work amongst threads is distributed unevenly, will continue to be reported as CXPACKET waits. But the “good” type of wait, where the consumer threads are just waiting for all the producer threads to do their work, will now be reported under a new wait called CXCONSUMER.
The benefit of this change is that you can continue to monitor CXPACKET waits, and when you have high waits there, you know there is something relevant and actionable that’s being reported. In most optimal systems, you should see the CXPACKET numbers dwindle, and the CXCONSUMER waits increase. CXPACKET waits will stay high if you have skewed parallelism, either due to the most common case of outdated statistics, or less common cases like intra-query blocking.
It is important not to suddenly have knee-jerk reactions to this new CXCONSUMER wait type because, as mentioned above, this wait simply means that parallelism is occurring. In fact, Microsoft recently added the ability to view wait statistics in a query’s showplan output, and they ignored CXPACKET because of how often it really is a red herring; with this new change, CXPACKET will now be reported in the showplan output, but CXCONSUMER will be filtered out because it is benign.
That’s the good news. Unfortunately, there is some bad news, and that is that you have to change the way you monitor, report, and react to high CXPACKET waits, depending on whether the current instance has the new behavior. Essentially, your scripts and other tools will have to be able to differentiate between CXPACKET waits that might be a problem, and CXPACKET waits that are most likely a problem, which changes with the build of SQL Server.
SQL Server CXPAKET Wait Type Example
Borrowing from Paul Randal’s examples in his post, “More on CXPACKET Waits: Skewed Parallelism,” it is easy to demonstrate what can happen to CXPACKET waits and thread workload distribution when estimates are inaccurate. On a SQL Server 2016 SP1 system, I built the following table, and faked out the statistics on the table:
DROP TABLE IF EXISTS dbo.Test;
GO
CREATE TABLE dbo.Test
(
    [RowID] int IDENTITY,
    ParentID int,
    CurrentValue nvarchar(100),
    CONSTRAINT [PK_Test] PRIMARY KEY CLUSTERED ([RowID])
);
GO
INSERT INTO dbo.Test (ParentID, CurrentValue)
SELECT CASE WHEN (number % 3 = 0)
    THEN number - number % 6
    ELSE number END,
    N'Test' + CAST (number % 2 AS Nvarchar(11))
FROM master.dbo.spt_values
WHERE [type] = 'P';
GO
UPDATE STATISTICS dbo.Test (PK_Test)
  WITH ROWCOUNT = 10000000, PAGECOUNT = 1000000;
Then I ran the following code in a different window, observing the session_id (SPID):
SET NOCOUNT ON;
GO
BEGIN
  DECLARE @CurrentValue nvarchar(100);

  SELECT @CurrentValue = [CurrentValue]
    FROM dbo.Test
    ORDER BY NEWID() DESC;
END
GO 20000
Then I watched the waits in another window, by refreshing these results frequently while the original loop was running:
DECLARE @spid int = 55;
SELECT
    Wait_Type     = wait_type,
    Waiting_Tasks = waiting_tasks_count,
    Wait_Time_ms  = wait_time_ms
FROM sys.dm_exec_session_wait_stats
WHERE session_id = @spid
ORDER BY wait_time_ms DESC;
SELECT
    spid         = session_id,
    Thread       = exec_context_id,
    Wait_Time_ms = wait_duration_ms,
    Wait_Type    = wait_type,
    Blocker      = blocking_session_id,
    Resource     = resource_description
FROM sys.dm_os_waiting_tasks
WHERE session_id = @spid
ORDER BY exec_context_id;
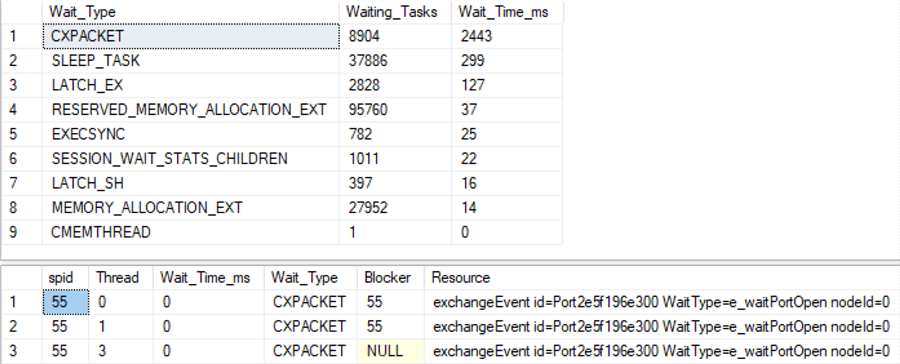
Here were the results shortly into the start of the script (note that we caught some intra-query blocking, intermittently):

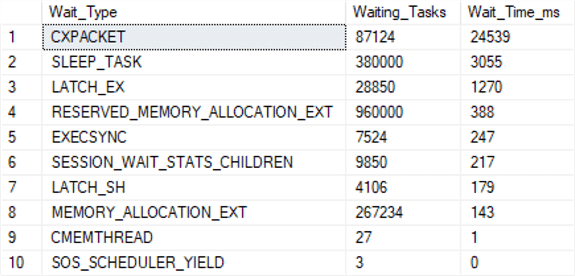
And here were just the waits after the script was finished:

Notice that CXPACKET waits are highest.
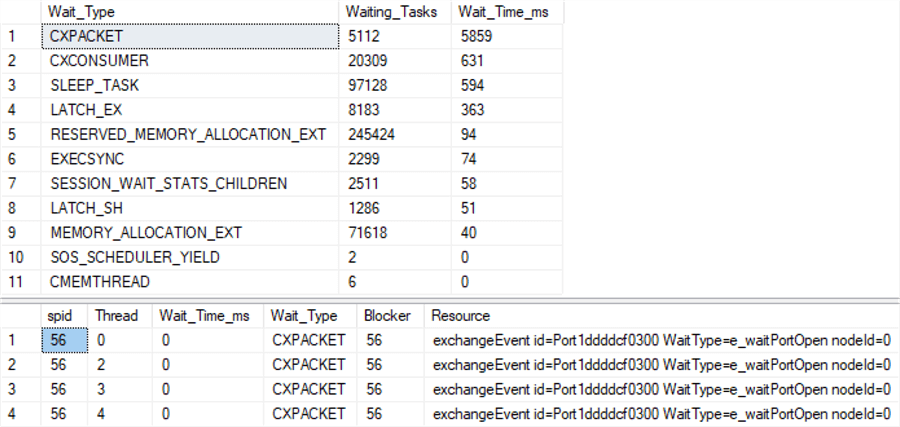
Then I applied Service Pack 2 (I had early access to a preview build), restarted the instance, and made sure the statistics were still inaccurate. I ran the loop in a new window, and here were the waits and blocking activity a few moments in:

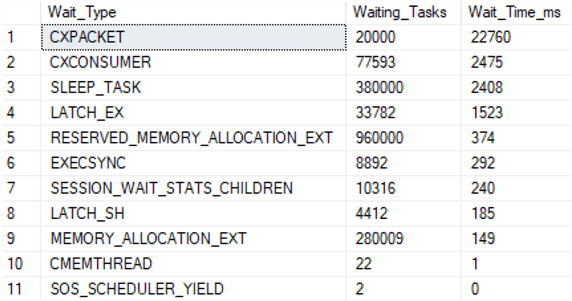
And here were just the waits after the script finished:

CXCONSUMER isn’t a huge portion of the wait profile, but at a little over 10% of the CXPACKET waits, you can see how it’s already separating the good parallelism from the bad parallelism. This is of course a contrived test, and SQL Server is employing parallelism poorly because it still incorrectly thinks the table is huge. When you have a real workload against a big table that can implement parallelism properly and effectively, you’ll see that CXCONSUMER becomes a much larger part of the picture, and CXPACKET waits will dwindle. Which means you’ll spend less time troubleshooting benign parallelism waits (just make sure to add CXCONSUMER to the wait types ignored by your scripts or monitoring tools).
What To Do with CXPACKET Wait Types in SQL Server
If you can’t get to the latest builds of SQL Server, you have to continue monitoring and troubleshooting CXPACKET waits the old way. Paul has some great advice in his two posts, “Knee-Jerk Wait Statistics : CXPACKET,” and, “More on CXPACKET Waits: Skewed Parallelism.”
In either case, typically, if you determine that some of your queries are suffering from the “bad” type of parallelism, the solution will involve re-writing the query, changing indexes, or coming up with a better strategy for keeping statistics up to date. If the system is too volatile for that, you may look at other avenues, such as reducing MAXDOP. But be careful – don’t just automatically assume that 1 is the best answer; typically it will be something like 4 or 8. This will still allow some parallelism but it will reduce what I call “swarming” – where a bunch of query processes fight over consuming all of the cores. Another option (which you might do in conjunction) is to increase the Cost Threshold for Parallelism, from the default of 5, to a more reasonable number like 40 or 50. What this essentially does is tells SQL Server not to consider parallelism unless the estimated cost of a query is above a certain threshold. Pedro Lopes talks a bit about these (and provides links to other resources) in his recent post, “Making parallelism waits actionable.”
Next Steps
Have a look at these tips and other resources involving SQL Server parallelism and CXPACKET wait types:
- A closer look at CXPACKET wait type in SQL Server
- What MAXDOP setting should be used for SQL Server
- How to Force a Parallel Execution Plan in SQL Server 2016
- Tracking Query Statistics on Memory Grants and Parallelism in SQL Server 2016
- Testing SQL Server Query Performance Using Different Levels of Parallelism
- SQL Server Performance Tuning Tips
- Knee-Jerk Wait Statistics : CXPACKET
- More on CXPACKET Waits: Skewed Parallelism
- Making parallelism waits actionable
About the author
 Aaron Bertrand (@AaronBertrand) is a passionate technologist with industry experience dating back to Classic ASP and SQL Server 6.5. He is editor-in-chief of the performance-related blog, SQLPerformance.com, and also blogs at sqlblog.org.
This author pledges the content of this article is based on professional experience and not AI generated.
View all my tips
Article Last Updated: 2017-12-18


