By: Nisarg Upadhyay | Updated: 2018-05-31 | Comments | Related: > SQL Server Management Studio
Problem
In this article, I am going to explain how to add a custom widget to SQL Server Operations Studio.
Solution
SQL Server Operations Studio is a cross platform, open source database management tool. It is platform independent hence it can be installed on Windows, Linux and macOS. It can be used to manage SQL Server running on any OS platform. We can also manage Azure SQL databases and SQL Azure SQL Data warehouses. It is not a replacement of SQL Server Management Studio, but it provides more facilities and configuration options. You can view query results in various formats like JSON, CSV and Excel. It also provides more advanced coding features like T-SQL code formatting, auto-suggestions, etc.
You can download SQL Server Operations Studio preview from this location.
On GitbHub, a few extensions have been developed which can be integrated with SQL Server Operations Studio that helps DBAs manage databases more efficiently. If you do not want to integrate these extensions, we can create our own custom widgets and place on the dashboard which can make database monitoring more efficient.
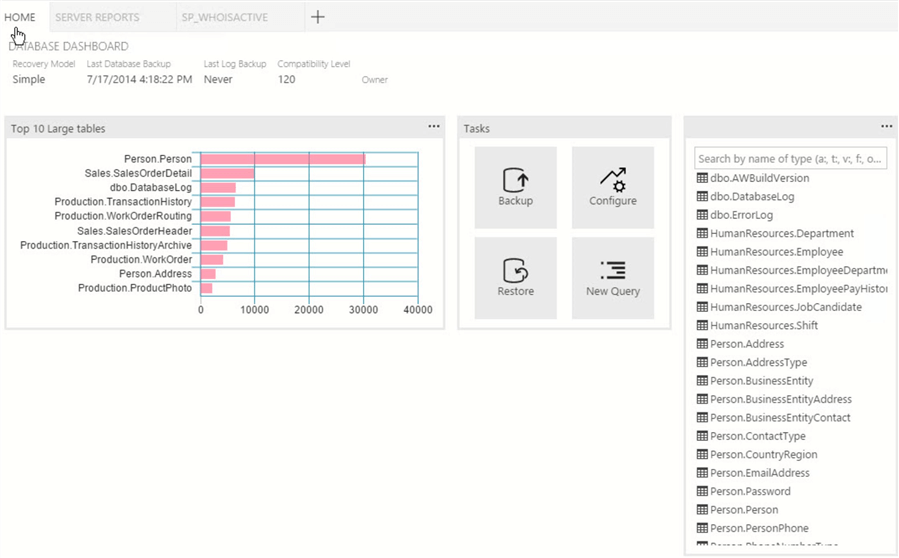
In this tip, I am going to demonstrate how to create a custom insight widget to display the top 10 largest tables of a database on the SQL Server Operations Studio dashboard.
For this demo, I have developed a script which will give me the list of the top 10 largest tables of any database. I am going to use “AdventureWorks2014” database. By executing the following script, you can get list of the top 10 largest tables for a database.
Use AdventureWorks2014
Go

select Top 10 object_schema_name(object_id) + '.' + object_name(object_id) as 'Table Name'
   , Convert(Numeric(10,2),(sum( case
   when index_id<2 then in_row_data_page_count + lob_used_page_count + row_overflow_used_page_count
   else lob_used_page_count + row_overflow_used_page_count
   end )*8)) as 'Table Size in MB'
from sys.dm_db_partition_stats
where object_id > 1024 and  object_name(object_id) in (select table_name from INFORMATION_SCHEMA.TABLES)
group by object_id
order by
sum( case
     when index_id<2 then in_row_data_page_count + lob_used_page_count + row_overflow_used_page_count
     else lob_used_page_count + row_overflow_used_page_count
    end )*8
desc
Create custom widget in SQL Operations Studio
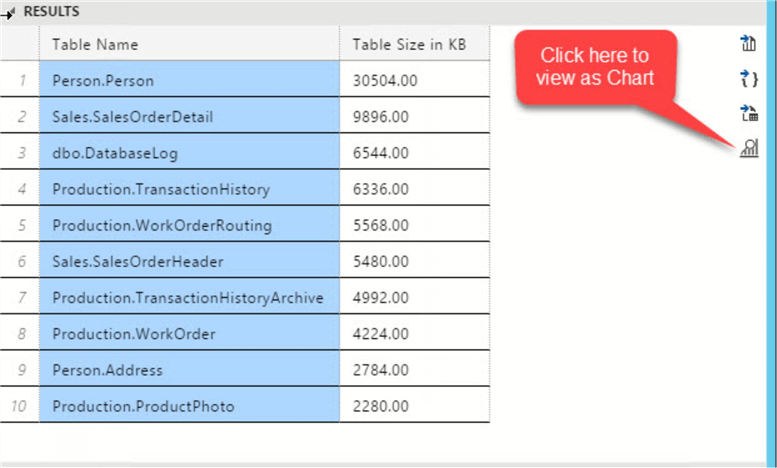
First, we will save the above query to a file. I copied the above query to my desktop. Now let's create a custom widget to show the results of the query. To do that, open the query editor, paste the above query and execute it. Now in the results window, click on the “View as Chart” option which is on the right side of the query result window as shown in the below image:
The entire result set will be presented as a chart in a separate tab named “Chart viewer”. Click on Create Insight option which is on the top left of the chart window as shown in the below image:
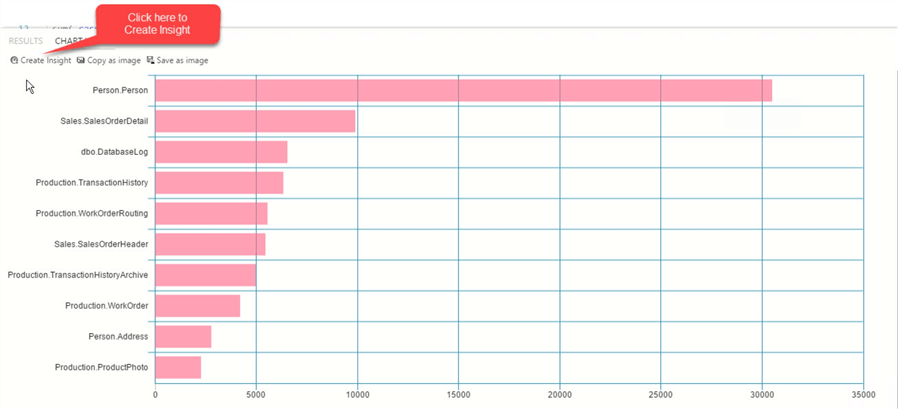
The create insight option will create JSON code which will be used to configure the user defined settings in the SQL Server Operations Studio dashboard.
When I click on “Create Insight”, the below code will be generated.
{
    "name": "My-Widget",
    "gridItemConfig": {
        "sizex": 2,
        "sizey": 1
    },
    "widget": {
        "insights-widget": {
            "type": {
                "horizontalBar": {
                    "dataDirection": "vertical",
                    "dataType": "number",
                    "legendPosition": "none",
                    "labelFirstColumn": false,
                    "columnsAsLabels": false
                }
            },
            "queryFile": "SQLQuery1"
        }
    }
}
Now, we will make two changes to the above JSON script.
- Change the widget name from “My-Widget” to “Top 10 Large tables”.
- Replace the “SQLQuery1” with the fully qualified name of SQL Script, saved on the Desktop.
"queryFile": "C:\\Users\\Administrator\\Desktop\\SOS_Query\\PersonTables.sql"
The updated code will look like below:
{
    "name": "Top 10 Large tables",
    "gridItemConfig": {
        "sizex": 2,
        "sizey": 1
    },
    "widget": {
        "insights-widget": {
            "type": {
                "horizontalBar": {
                    "dataDirection": "vertical",
                    "dataType": "number",
                    "legendPosition": "none",
                    "labelFirstColumn": false,
                    "columnsAsLabels": false
                }
            },
            "queryFile": "C:\\Users\\Administrator\\Desktop\\SOS_Query\\PersonTables.sql"
        }
    }
}
Now we will add the above JSON code in the user defined settings. To do that, press [Ctrl]+[,]. Type “dashboard” in the search settings window as shown and click on “Edit” for “dashboard.database.widgets” as shown in the below image:
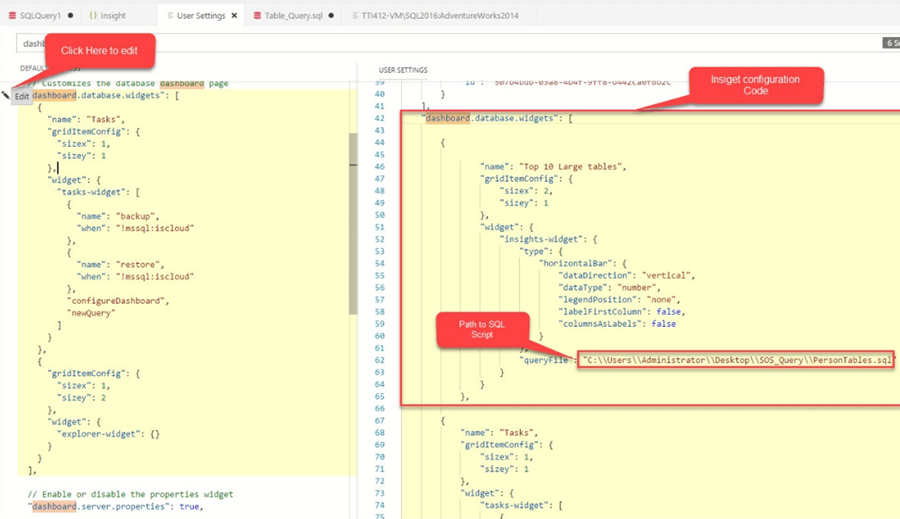
Copy and paste the above configuration JSON code into “dashboard.database.widgets”. The entire code is shown below:
    "dashboard.database.widgets": [

        {
    "name": "Top 10 Large Tables",
    "gridItemConfig": {
        "sizex": 2,
        "sizey": 1
    },
    "widget": {
        "insights-widget": {
            "type": {
                "horizontalBar": {
                    "dataDirection": "vertical",
                    "dataType": "number",
                    "legendPosition": "none",
                    "labelFirstColumn": false,
                    "columnsAsLabels": false
                }
            },
            "queryFile": "C:\\Users\\Administrator\\Desktop\\SOS_Query\\PersonTables.sql"
        }
    }
},

        {
            "name": "Tasks",
            "gridItemConfig": {
                "sizex": 1,
                "sizey": 1
            },
            "widget": {
                "tasks-widget": [
                    {
                        "name": "backup",
                        "when": "!mssql:iscloud"
                    },
                    {
                        "name": "restore",
                        "when": "!mssql:iscloud"
                    },
                    "configureDashboard",
                    "newQuery"
                ]
            }
        },
        {
            "gridItemConfig": {
                "sizex": 1,
                "sizey": 2
            },
            "widget": {
                "explorer-widget": {}
            }
        }
    ],
Save and close the user settings.
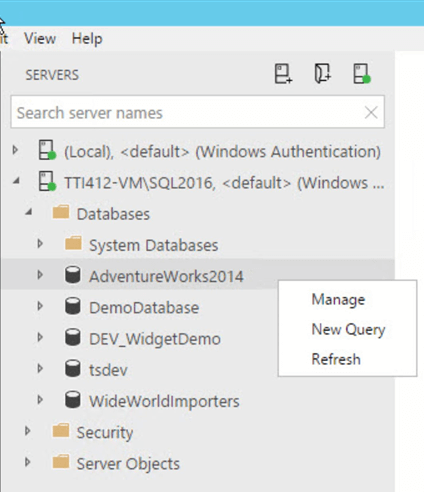
Now to view the dashboard, right click on the “AdventureWorks2014” database and select “Manage” as shown in the below image.
As the above query is executing the first time, the widget will take a while to load. Once it’s loaded, the entire dashboard will look like the below image.
Summary
In this tip, I demonstrated how can we create a custom widget and show it in SQL Server Operations Studio.
Next Steps
- Read more about installing and configuring SQL Server Operations Studio.
- Check out this tip about backup and restore using SQL Server Operations Studio.
About the author
 Nisarg Upadhyay is a SQL Server Database Administrator and Microsoft certified professional with more than 5 years of experience.
This author pledges the content of this article is based on professional experience and not AI generated.
View all my tips
Article Last Updated: 2018-05-31


