By: Diana Moldovan | Updated: 2018-07-10 | Comments | Related: 1 | 2 | 3 | 4 | 5 | 6 | 7 | > Service Broker
Problem
In this tip I’ll describe a connectivity issue I’ve encountered while setting up Service Broker communications across SQL Server instances.
Solution
I’ll use the following SQL Server Service Broker test environment:
Initiator
- Windows 10 Enterprise version 1703 OS Build 15063.7026 (my dev physical machine)
- SQL 2014 SP2 version 12.0.5207.0
- Ports 1433 and 4023 are open
- TCP/IP protocol is enabled
Target
- Windows Server 2012 R2 Standard (virtual machine)
- SQL 2014 SP2 version 12.0.5000.0
- Ports 1433 and 4022 are open
- TCP/IP protocol is enabled
SQL Server Service Broker Error Messages
This is one of the most difficult to deal with error messages I’ve encountered:
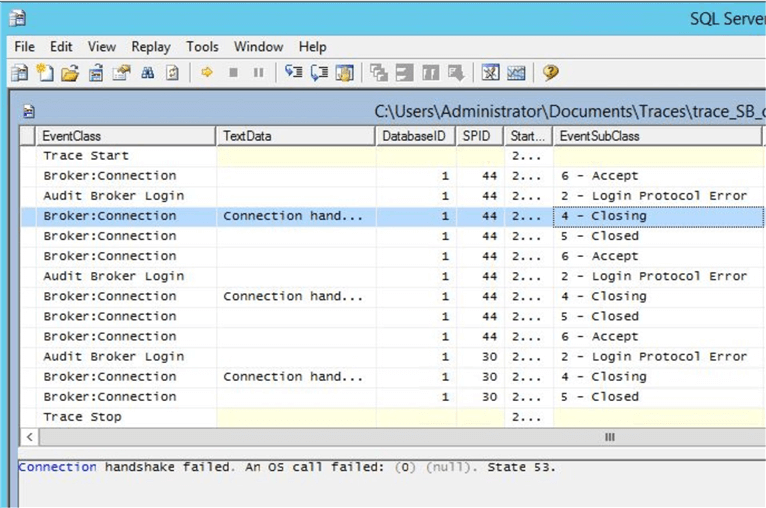
This message appeared in the initiator’s sys.transmission_queue.transmission_status. I’ve followed this post and set up a Profiler session (Broker Connection and Audit Broker Login event classes) on the target machine to find out why the connection was “forcibly closed”. You can find the script for the trace session creation (SB_err_msgs_trace.sql) in the archive attached.
From the trace file EventSubClass column I could see that the connection was first accepted, then there was a “login protocol error” with a CERTIFICATE authentication method (“OwnerName”), then the connection was closed. There was another error message in the TextData column – “Connection handshake failed. An OS call failed: (0) (null). State 53.”

There were also additional error messages in the Windows Application error log and SQL Server log on the target machine:
A cryptographic operation failed. This error indicates a serious problem with SQL Server. Check the SQL Server error log and the Windows event logs for further information.
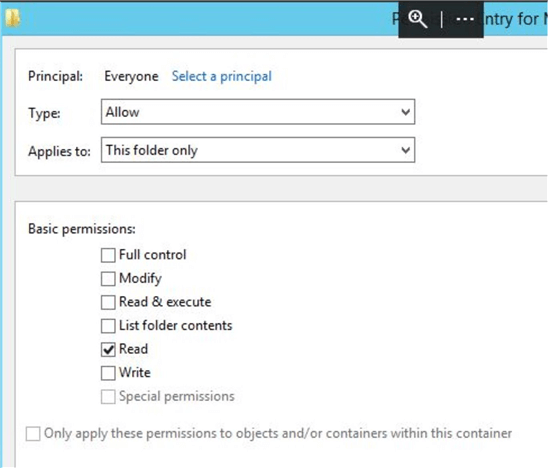
After additional searches, I checked the permissions on the target’s C:\ProgramData\Microsoft\Crypto\RSA\MachineKeys folder. I saw that the Everyone group had only Read permissions on this folder on my target machine; however, according to the Microsoft knowledge base article, Everyone should have a set of “special permissions” on this folder. The article refers to the Windows Server 2003 editions, but is still useful for Windows Server 2012 R2.

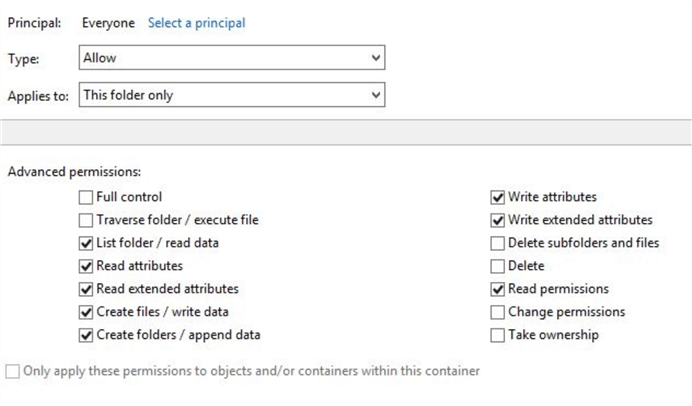
To set up the minimal set of permissions, I went to the folder’s properties Security tab. I chose Advanced > Everyone > Edit > Show advanced permissions. I added Create files/write Data, Create folders/Append data, Write attributes and Write extended attributes to the existing permissions (List folder / read data, Read attributes, Read extended attributes, Read permissions).

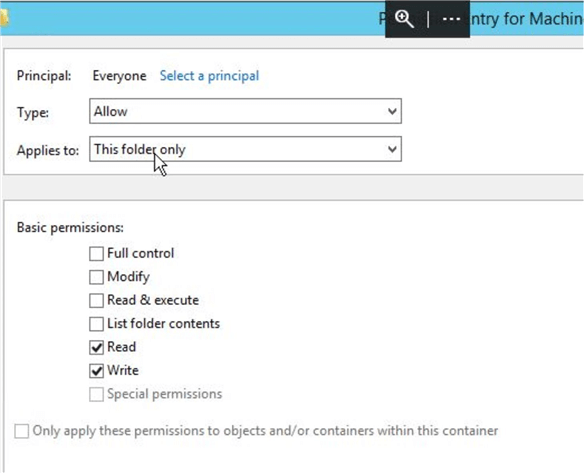
The basic permissions on the folder will show Read and Write.

You should also check the inheritance of the rights on the child files.
After updating the Everyone permissions on the MachineKeys folder on the target side the communication between the servers worked fine.
Tracking the Service Broker logins with Extended Events and SQL Server Audit
Since Profiler will be replaced with Extended Events in a future SQL Server edition, I always try to convert the traces I’m still using. Here I need the Extended Events correspondents for the Broker:Conection and Audit Broker Login events. I used this script to convert a trace to extended events, but the conversion was not as simple as I thought it would be.
For Audit Broker Login, the script returns “This event is not implemented in Extended Events, it may be a Server Audit Event”. Unfortunately, it seems that the equivalents of the two Profiler events have to be tracked separately.
Indeed the BROKER_LOGIN_GROUP action group is the equivalent of the Audit Broker Login event class. Please find the script for the server audit and server audit specification (SB_err_msgs_sqlaudit.sql) in the archive I’ve attached.
The Extended Events correspondent for the Broker:Conection event is “ucs_connection_setup”. SB_err_msgs_xevents.sql creates the event session you need to run.
To track the broker login, I had to run the Extended Events session and the server audit simultaneously. I used sys.fn_get_audit_file to read the audit output file:
SELECT * FROM sys.fn_get_audit_file ('<audit output file location>', DEFAULT, DEFAULT)
The easiest way to read the .xel (Extended Events) output file is a double click.
I worked on a test environment where hardly any other user work happens. The outputs were tiny enough, just a few rows of data. Therefore, correlating the results was not a difficult task. The audit output returns 2 rows with action_id = LGB, i.e. “broker login”, and succeeded = 0. Unfortunately, there are no other useful details in the result. The additional_information field returns nothing I did not already know:
<action_info xmlns="http://schemas.microsoft.com/sqlserver/2008/sqlaudit_data">
   <peer_ip_address><source ip number></peer_ip_address>
   <endpoint_role_name>Target</endpoint_role_name>
   <target_authentication_method>CERTIFICATE</target_authentication_method>
   <sspi_package><![CDATA[Microsoft Unified Security Protocol Provider]]></sspi_package>
</action_info>
The .xel output also returns 2 records containing the “Connection handshake failed” error message.
Correlating the 2 outputs is much more difficult in a busier environment. Take into consideration that the audit “event_ time” seem to record the UTC time, whereas the Extended Events “timestamp” returns the local time.
This time my vote goes to good old Profiler.
Next Steps
- On most machines the permissions on the MachineKeys folder should be correctly configured. “Everyone” should have the correct set of special permissions, as listed in the Microsoft KB. However, if, for whatever reason, these permissions are removed or altered you may find yourself in trouble.
- Find out more about the Windows Server 2016 special identities and please be aware of the permissions you may need to grant them on your resources.
About the author
 Diana Moldovan is a DBA and data centric applications developer with 6 years of experience covering SQL 2000, SQL 2005 and SQL 2008.
This author pledges the content of this article is based on professional experience and not AI generated.
View all my tips
Article Last Updated: 2018-07-10


