By: Jim Evans | Updated: 2019-08-01 | Comments (1) | Related: > Monitoring
Problem
There are many ways to monitor a SQL Server including using SQL performance counters, watching file growth or using 3rd party tools. Have you ever considered what transaction logs can tell you about the activity on your SQL Server? Another way to think of this is, like looking at traffic patterns or trying to find your database rush hour. On one system that I supported I was aware of performance problems that occurred on Fridays, specifically around weekly billing processes. However, when I analyzed log growths, I found something unexpected. The system had significantly more log activity earlier in the week, primarily on Monday and Tuesdays. When I dug deeper, I found that the log activity earlier in the week was based on Order Entry processes. The results of my analysis were that the Order Entry process was more optimized and consumed less reads. Whereas the Invoice Processing at the end of the week was made up of a less optimal higher read process. The analysis of the transaction log was interesting because it helped me visualize the weekly activity characteristics of my database and showed me something unexpected.
Solution
How to analyze SQL Server Activity based transaction log backup size to get a visual characteristic of your database or SQL server.
Analyzing SQL Server Database Transaction Log Activity
To analyze the SQL activity based on transaction size run the following queries. In the examples we will look at the entire SQL Server and individual database examples. This is good to do when you have multiple database with high activity. Note that this solution is only effective on databases that are in the Full Recovery model and have regular transaction log backups. The grain that you analyze is dependent on the frequency of the transaction log backups. Generally, full recovery databases have transaction log backups scheduled every hour or more frequent than hourly. For this exercise the databases I will analyze have transaction log backups every hour or more.
Solution 1 – Activity Based on Transaction Log Size – Database Level
In this example I am using the SUM aggregate go get total transaction log backup sizes in MB rolled up by hour for each day of the week. This has 2 parameters: (1) @NumWeeks which I generally set to 8 weeks; (2) @Database which can be set to analyze a single database or set to NULL to analyze all the database on a server with transaction log backups.
--Database LEVEL: SUM
--SUM: May be large for a large date range for analysis. this is my preferred over an 8 week period.
DECLARE @NumWeeks INT = 8 --<< SET the number of weeks to analyze.
DECLARE @Database nvarchar(100) = 'YourDBName'
SELECT
   @@servername as 'Server', --For all full recovery model DBs
    a.database_name,
   datepart(Hour,a.backup_start_date) as 'Hour',
   convert(int,SUM(CASE WHEN charindex('Sunday',datename(weekday,a.backup_start_date)) > 0 then ceiling(a.backup_size/1048576.00) End)) as 'Sun_size(MB)',
   convert(int,SUM(CASE WHEN charindex('Monday',datename(weekday,a.backup_start_date)) > 0 then ceiling(a.backup_size/1048576.00) End))  as 'Mon_size(MB)',
   convert(int,SUM(CASE WHEN charindex('Tuesday',datename(weekday,a.backup_start_date)) > 0 then ceiling(a.backup_size/1048576.00) End)) as 'Tue_size(MB)',
   convert(int,SUM(CASE WHEN charindex('Wednesday',datename(weekday,a.backup_start_date)) > 0 then ceiling(a.backup_size/1048576.00) End)) as 'Wed_size(MB)',
   convert(int,SUM(CASE WHEN charindex('Thursday',datename(weekday,a.backup_start_date)) > 0 then ceiling(a.backup_size/1048576.00) End)) as 'Thu_size(MB)',
   convert(int,SUM(CASE WHEN charindex('Friday',datename(weekday,a.backup_start_date)) > 0 then ceiling(a.backup_size/1048576.00) End)) as 'Fri_size(MB)',
   convert(int,SUM(CASE WHEN charindex('Saturday',datename(weekday,a.backup_start_date)) > 0 then ceiling(a.backup_size/1048576.00) End)) as 'Sat_size(MB)'
   ,MIN(a.backup_start_date ) as 'From:'
   ,MAX(a.backup_start_date ) as 'To:'
   ,COUNT(*) as 'NumberLogBackups'
FROM msdb.dbo.backupset a (NOLOCK)
WHERE a.type = 'L' --log backups
AND (a.database_name = @Database --Target Database
      OR @Database IS NULL)
AND a.backup_start_date >= DATEADD(WEEK, DATEDIFF(WEEK,-1,GETDATE())-1*@NumWeeks,-1)  --Note: -1 Starts us at Sunday.
AND a.backup_start_date < DATEADD(WEEK, DATEDIFF(WEEK,-1,GETDATE()),-1)
GROUP BY a.database_name,
  datepart(Hour,a.backup_start_date)
ORDER BY a.database_name,
  datepart(Hour,a.backup_start_date)
GO
Activity Based on Transaction Log Size – Database Level Results
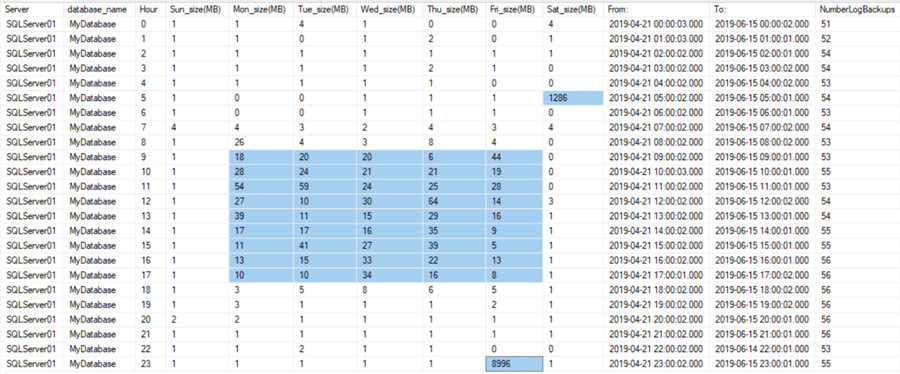
In this sample the result show steady database transaction activity Monday through Friday between 9 am and 5 pm with a potential maintenance or batch job running Friday evening 11 pm and Saturday morning at 5 am.

Solution 2 – Activity Based on Transaction Log Size – Server Level
In this example the roll up is at the Server Level and includes all databases in Full Recovery model with transaction log backups. Here I have 1 parameter, @NumWeeks which I generally set to 8 weeks. Also, in this example I add a twist, doing the SUM of all database transaction log backup sizes in MB divided by the number of weeks in the analysis yielding more of an average rolled up by hour for each day of the week. With the smaller values it is easier to see the patterns.
--Server Level:
--Uses Sum / Number of week
DECLARE @NumWeeks INT = 8
SELECT
   @@servername as 'Server', --For all full recovery model DBs
   datepart(Hour,a.backup_start_date) as 'Hour',
   convert(int,SUM(CASE WHEN charindex('Sunday',datename(weekday,a.backup_start_date)) > 0 then ceiling(a.backup_size/1048576.00) End)/@NumWeeks) as 'Sun_size(MB)',
   convert(int,SUM(CASE WHEN charindex('Monday',datename(weekday,a.backup_start_date)) > 0 then ceiling(a.backup_size/1048576.00) End)/@NumWeeks)  as 'Mon_size(MB)',
   convert(int,SUM(CASE WHEN charindex('Tuesday',datename(weekday,a.backup_start_date)) > 0 then ceiling(a.backup_size/1048576.00) End)/@NumWeeks) as 'Tue_size(MB)',
   convert(int,SUM(CASE WHEN charindex('Wednesday',datename(weekday,a.backup_start_date)) > 0 then ceiling(a.backup_size/1048576.00) End)/@NumWeeks) as 'Wed_size(MB)',
   convert(int,SUM(CASE WHEN charindex('Thursday',datename(weekday,a.backup_start_date)) > 0 then ceiling(a.backup_size/1048576.00) End)/@NumWeeks) as 'Thu_size(MB)',
   convert(int,SUM(CASE WHEN charindex('Friday',datename(weekday,a.backup_start_date)) > 0 then ceiling(a.backup_size/1048576.00) End)/@NumWeeks) as 'Fri_size(MB)',
   convert(int,SUM(CASE WHEN charindex('Saturday',datename(weekday,a.backup_start_date)) > 0 then ceiling(a.backup_size/1048576.00) End)/@NumWeeks) as 'Sat_size(MB)'
   ,MIN(a.backup_start_date ) as 'From:'
   ,MAX(a.backup_start_date ) as 'To:'
   ,COUNT(*) as 'NumberLogBackups'
FROM msdb.dbo.backupset a
WHERE a.type = 'L' --log backups
AND a.backup_start_date >= DATEADD(WEEK, DATEDIFF(WEEK,-1,GETDATE())-1*@NumWeeks,-1)
AND a.backup_start_date < DATEADD(WEEK, DATEDIFF(WEEK,-1,GETDATE()),-1)
GROUP BY datepart(Hour,a.backup_start_date)
ORDER BY datepart(Hour,a.backup_start_date)
GO
Activity Based on Transaction Log Size – Server Level Results
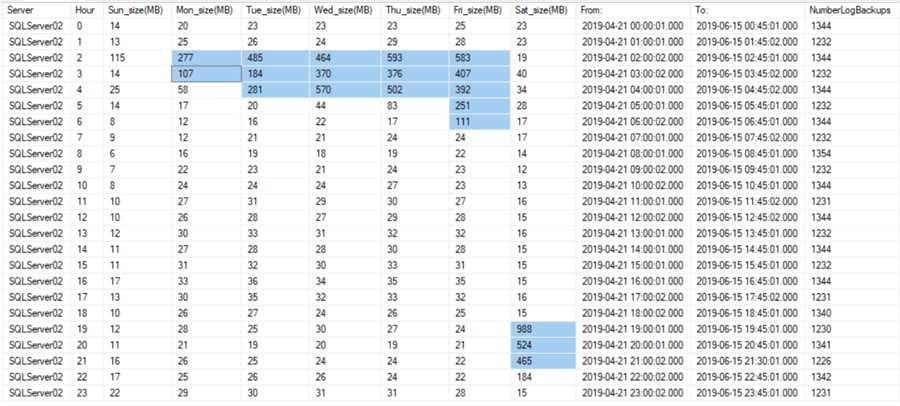
In this sample’s result we show minimal steady activity during business hours with increasing database transaction activity from Monday at 2 am increasing through Friday from 2 am to 6 am with potential maintenance or batch job activity on Saturday evening from 7 pm through 9 pm. To determine what is happening during the early morning activity I may look at SQL jobs to see what is running at this time and if any jobs tend to increase in runtime as the week progresses.

Wrap Up
I hope you find this demo useful in uncovering your database traffic patterns. Most databases that I have looked at show a different visual of their activity patterns. You may discover that your Index Maintenance window turns out to be your high activity based on transaction log entry. One application of this analysis is when you are looking for a window of inactivity to schedule new Jobs that may be resource intensive. Your results may be skewed if the database is changed to Bulk Log mode during index operations. Hopefully you find this interesting and helpful in uncovering information about your database activity that you were not fully aware of.
Next Steps
- Look for a follow up post on graphing your results in Excel to get a great visual of database activity based on Log Size.
- Read about Understanding SQL Server Recovery Models and Transaction Log
- Learn more on SQL Server Performance Tuning and Monitoring Tutorial
- Also see Performance Monitor
About the author
 Jim Evans is an IT Manager currently for Crowe who has managed DBA, Developer, BI and Data Management teams for over 20 years.
This author pledges the content of this article is based on professional experience and not AI generated.
View all my tips
Article Last Updated: 2019-08-01


