By: Mohammed Moinudheen | Updated: 2019-11-21 | Comments | Related: > Azure
Problem
I have a number of Azure resources to manage. It would be great if I could monitor my resources from a central location or a tool in Azure. How can we achieve this in Azure?
Solution
This tip assumes that you already have resources in your Azure environment and you are familiar with using the Azure portal. If you are new to Azure, you can subscribe to a trial account here, which will give you access to Azure services for a year and a credit of USD $200.
The easy answer for centralized monitoring in Azure is the Azure Monitor. In this tip, we will learn about the use of the Azure Monitor at a high level with some examples. Azure Monitor is a vast topic and is hard to cover it all in a single tip, but we will try to summarize the important aspects in this tip.
What is the Azure Monitor?
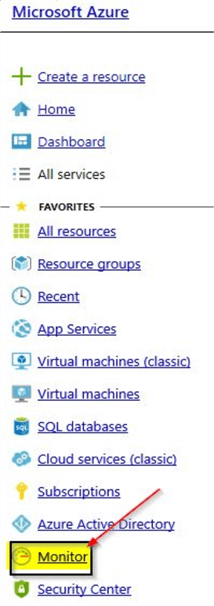
Azure Monitor is an end-to-end full stack monitoring capability available in Azure, which helps you to monitor your applications and infrastructure. The Azure Monitor is simple to use and is highly intuitive. You can start using this feature without any sort of prior knowledge, as the interface is totally user friendly. You can view the Azure Monitor option on the left side of the Azure portal as shown below.
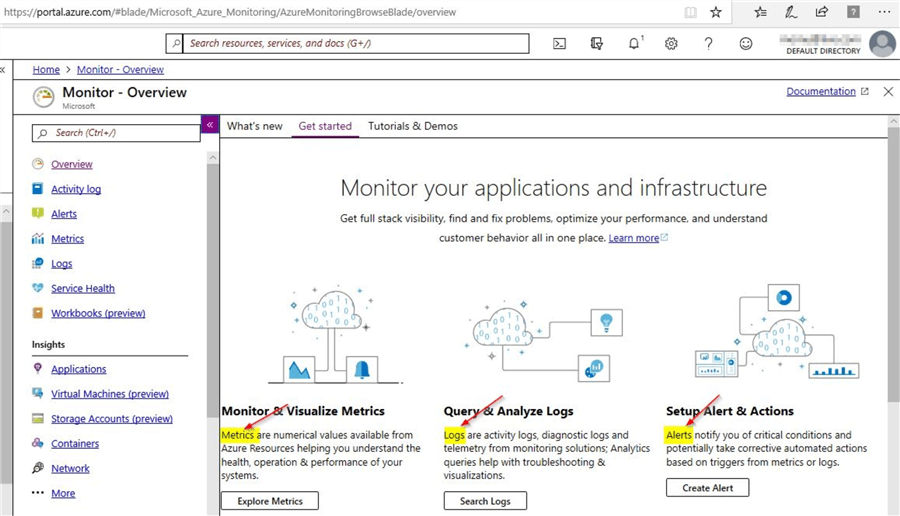
Once you click on "Monitor", you will see this screen, which summarizes the options available.
Data Collection in Azure Monitor - Metrics
From the Azure Monitor screen, you can see that there are two types of data collection occurring on the Azure Monitor – Metrics and Logs. Metrics are numerical data points recorded at a particular time for the resources.
Example of metrics collected on an Azure SQL database
Assuming you already have an Azure SQL database configured. Once you click on the "Overview" option on the SQL database, you will see this screen.
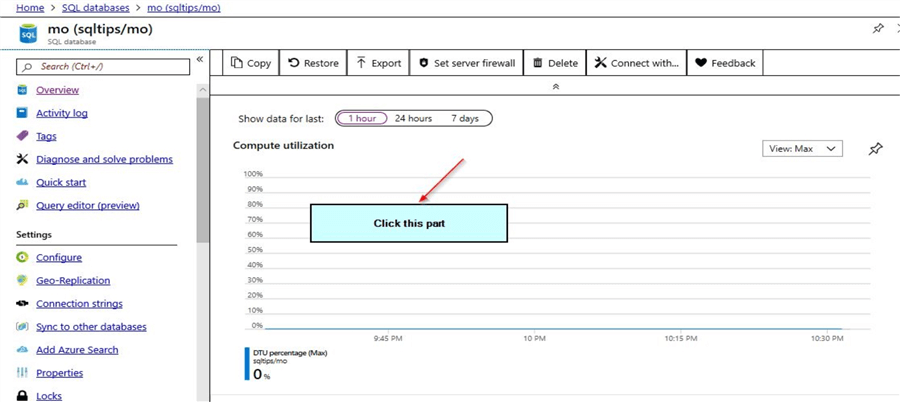
Once you click on the highlighted section, it will take you directly to Azure Monitor (Metrics) where you have the option to add additional metrics if required.
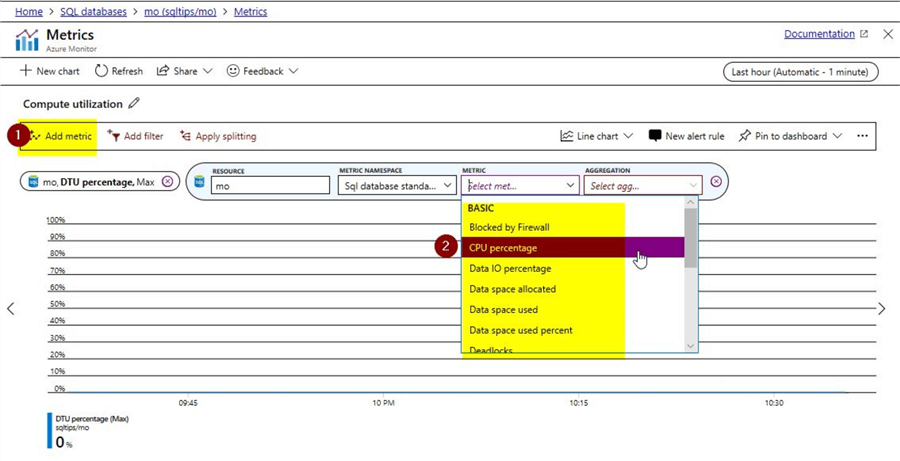
Here, you can see the different metric options that are available to add.
Data Collection in Azure Monitor - Logs
Another important category of data collected in the Azure Monitor falls under logs. In Azure, at a high-level, logs are further classified as activity logs and diagnostics logs. One example of activity logs are events. For example, stopping an Azure VM resource would fall under the category of activity log.
Example of activity logs collected from an Azure SQL database
When you view a SQL Azure database on the Azure portal, you will see this option – "Activity Log".
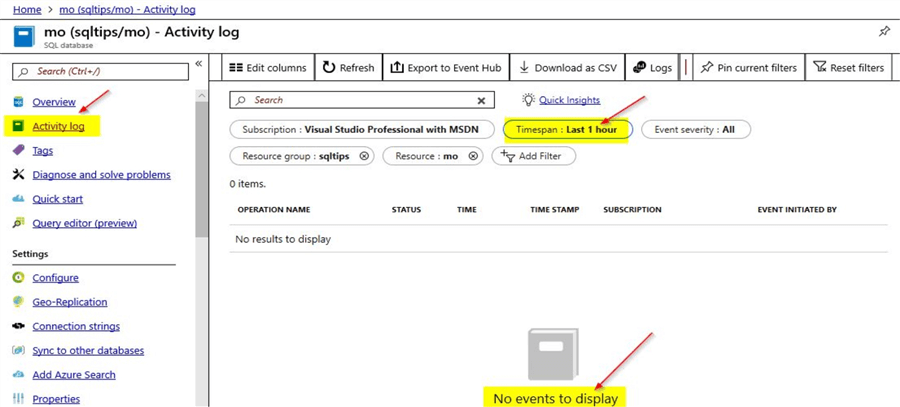
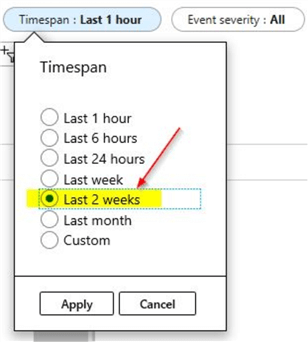
Under the activity logs for the database, you see that there are no events to display. Just try changing the timespan option to 2 weeks as shown and click on "Apply".
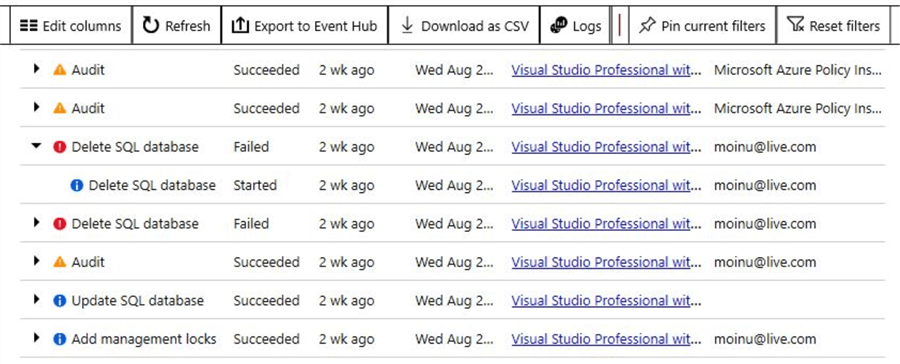
Once done, you will be able to view the different types of events in the activity log.
Example of diagnostic logs connected from an Azure SQL database
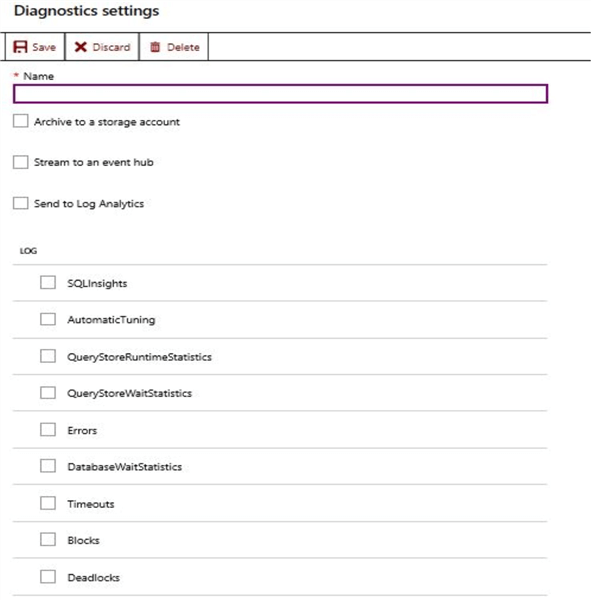
On an Azure SQL database, you have the option to enable the diagnostic setting by clicking on the ‘diagnostic settings’ option in the monitoring blade. Refer to the screenshot below.
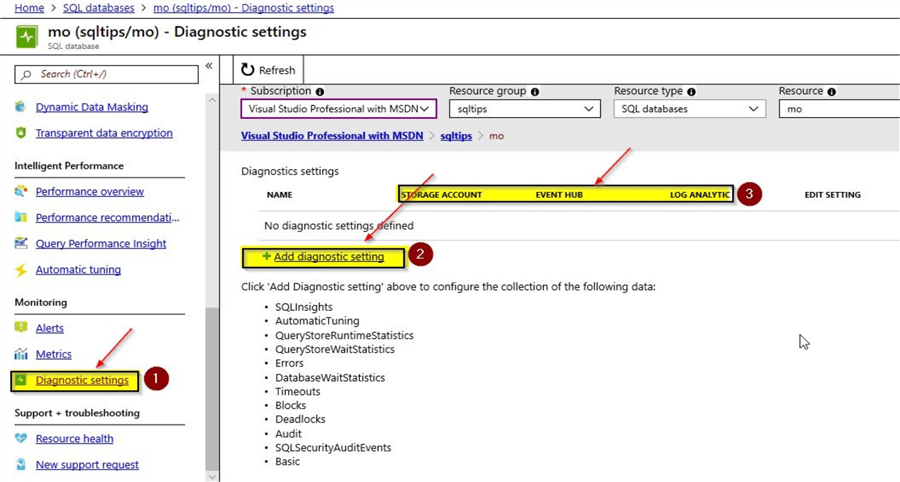
From the screenshot, you can see the different types of data we can collect by clicking on the "Add Diagnostic setting" option. We can save the data either in the storage account, event hub or on log analytic. When you click on the "Add diagnostic setting" option, you will view this screen where you can enable the different log categories that are available. Here, you can select the options based on your requirement for collecting the diagnostics logs.
Set up Alerts and Actions using Azure Monitor
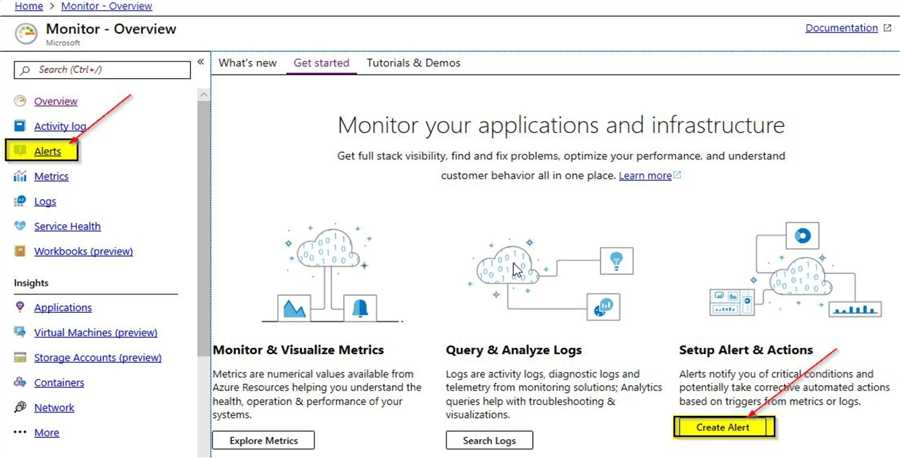
Another important function of the Azure Monitor is the capability of setting up alerts. With alerting, you can proactively monitor for any issues and take corrective actions as required. You can click on the alerting option in either of the locations as shown. Select the "Create Alert" option.
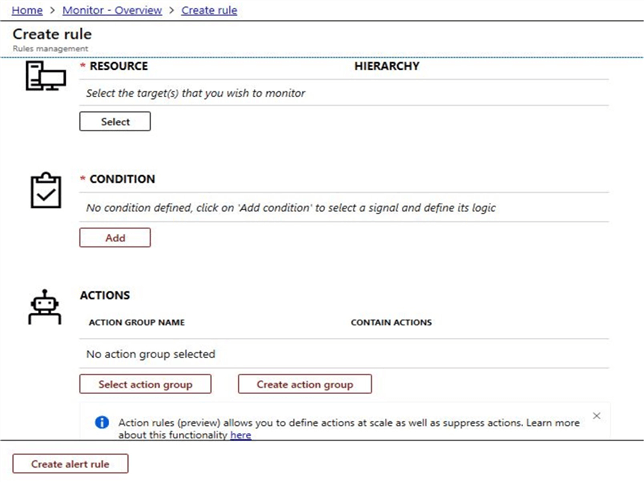
Once you select the "Create Alert" option, you will see this screen where you can select the target resource to monitor, add conditions and configure the action group.
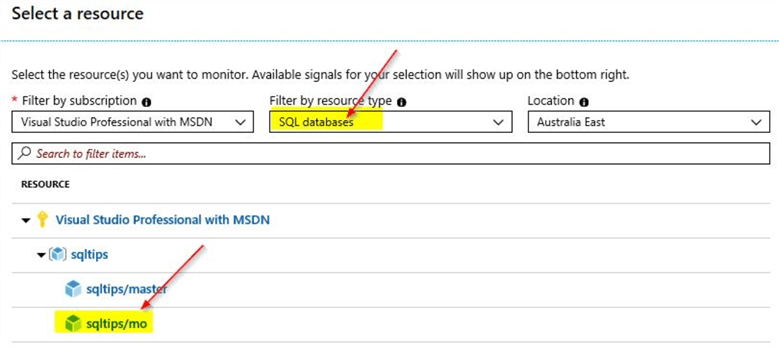
In the select target option, you have multiple options to select including options to select Azure SQL database. Select the required SQL database and click on "Done".
After selecting the target resource, the next step is to add the required condition for alerting.
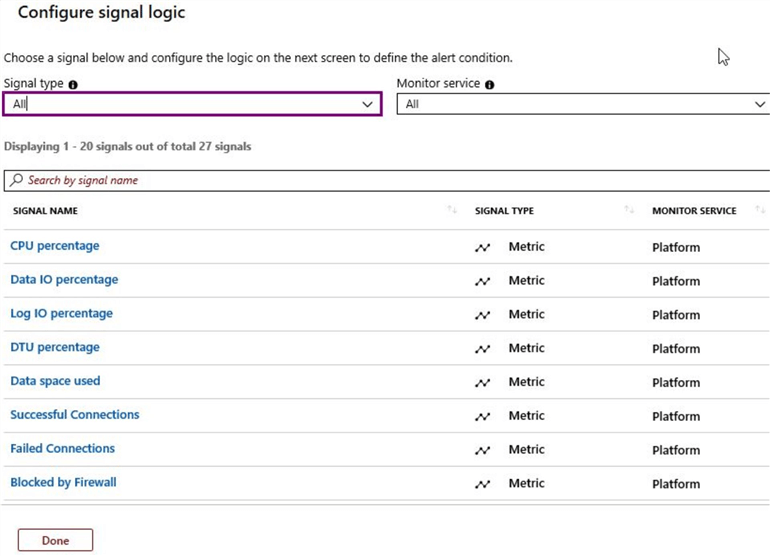
In the above screenshot, you can view the various conditions. Once you select a required condition, you need to provide a threshold value after which the alerting should trigger notifications. For example, if CPU percentage goes above 85%, then alerting should occur. Finally, under actions, you select the action group to whom notification need to be sent. For details on setting up the action group, refer to this tip, which explains the systematic process.
Other uses of Azure Monitor
In this tip, you learned about the Azure Monitor at a high level. You can review the various features available in the Azure Monitor by reviewing the options on the left side of the Azure portal.

Under insights, you can view some new options available like that of the one for storage accounts. When you click on that option, you will see this screen.
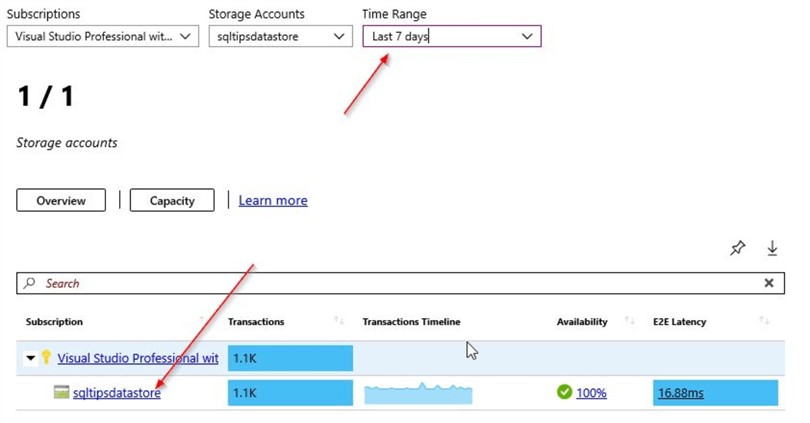
Once you click on the name of the storage account, you will be able to view additional information on the overall performance.
Is Azure Monitor free to use?
By now, I hope you are convinced of the use of this great tool for monitoring purposes. However, coming to the all-important question regarding cost, the reality is Azure Monitor is not entirely free. There are various pricing models available for using the different features that are available with the Azure Monitor. You can refer to this Microsoft link, which has all the details regarding the pricing and usage. You will see this screen when you go to this pricing link.
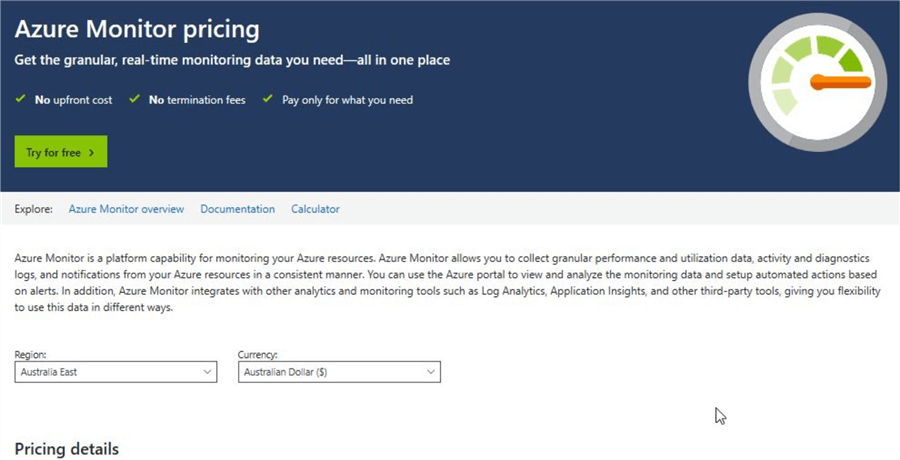
Select the currency based on your choice of region. The pricing details are quite precise with no room for any confusion. You can refer an example below from the pricing link.
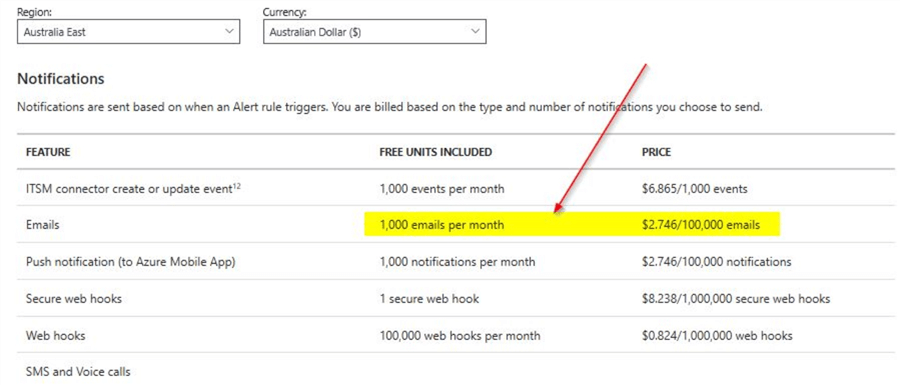
On reviewing the pricing for the different Azure Monitor features, we can see the cost is quite competitive and we get the benefit of using the advanced features available within the Azure Monitor for a reasonably good price.
What if I am still not convinced with the Azure Monitor pricing as my fear is that it can get expensive eventually?
Yes, it is possible to get overwhelmed with all the various pricing options that are available in the Azure pricing link. Well, there is another option to estimate the pricing for the Azure Monitor by using the pricing calculator instead. With the Azure pricing calculator, you can estimate almost accurately based on the number of resources and the overall cost you may need to pay for using the features within the Azure Monitor. Below is a screenshot of the pricing calculator.
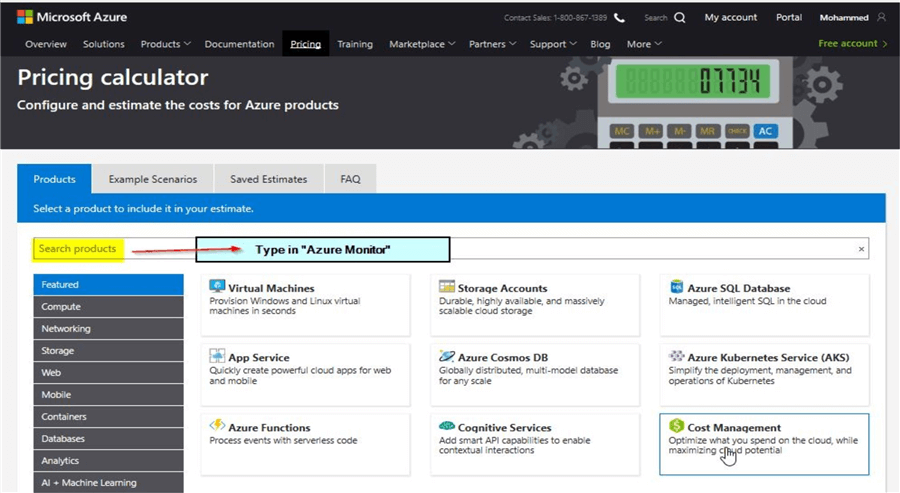
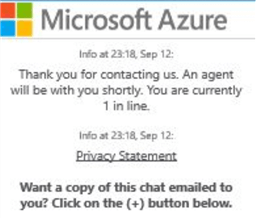
Once you type in "Azure Monitor", you will view the options that are available for the Azure Monitor. For example, you can key in values like the number of estimated emails you plan to send, number of virtual machines you wish to monitor, etc. If you are still not convinced in the Azure pricing calculator, you will view the option to "Chat with Sales" in the lower right corner. Just go ahead and chat directly with an Azure sales agent to clarify any further questions you may have.
Next Steps
- In this tip, you learned about the use of Azure Monitor
- In this tip, you learned about the different types of data collected in the Azure Monitor
- You saw how alerts can be set up easily for the target resources
- You saw the various options that are available within the Azure Monitor
- You learned about the pricing information for the Azure Monitor
- You learned about a tool known as the Azure pricing calculator to estimate Azure Monitor pricing
- Try out this demo on your own Azure environment
- Refer to these other articles available on MSSQLTIPS related to Azure
About the author
 Mohammed Moinudheen is a SQL Server DBA with over 6 years experience managing production databases for a few Fortune 500 companies.
This author pledges the content of this article is based on professional experience and not AI generated.
View all my tips
Article Last Updated: 2019-11-21


