By: Maria Zakourdaev | Updated: 2020-01-09 | Comments | Related: > Amazon AWS
Problem
There are days when you feel like shopping. You feel like buying something really good. Like an extra-large EC2 instance or maybe a mega fast SQL Server RDS. Spinning up the hardware resources is so easy when you are using a cloud provider. Just a few clicks here and a few clicks there and you end up with a thousand-dollar monthly bill. How do you track the expenses and keep your finger on the pulse?
Solution
There are several ways to track your expenses in AWS Cloud. You can use the AWS Cost and Billing dashboard to see the daily costs by region, resource, tag or anything else. You can configure delivery of Cost and Billing csv reports to S3.
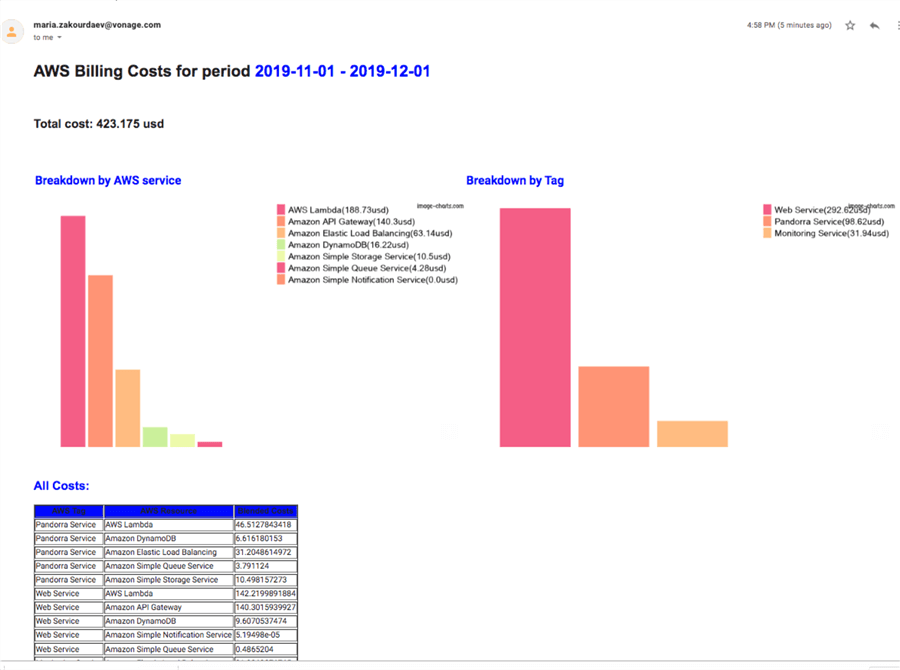
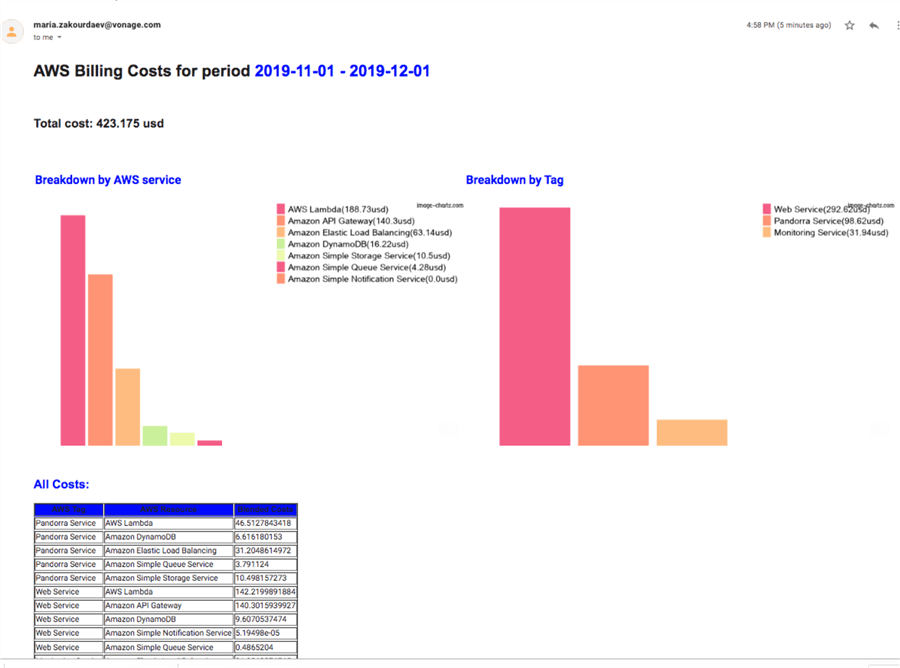
I will show you my solution to this problem, I use a Glue job that gets the costs data through AWS API, sends an email with an HTML body and includes some cool free visualizations using image-charts.com (Google Charts API replacement).
Here is how the final email will look:

AWS Glue Job
I will not describe how great the AWS Glue ETL service is and how to create a job, I have another blogpost about creating jobs in Glue, you are invited to check it out if you are new to this service.
You will need to create a job of type Python shell.

Below you will find a Python script with my comments. Note: most of the code can be copy and pasted and will work in Python. Functions and loops must be copied to test the editor first to make sure that the indentation is correct. In some cases, it will be broken after copying.
Getting the Data
I will connect to AWS Billing and the cost explorer module to fetch the data. All my AWS resources have a specific tag 'Role' and I will be able to break down the costs by that tag. Adding tags to the cloud resources is very useful and a good practice.
import boto3
import datetime
import pandas as pd
import numpy
import smtplib
from email.mime.text import MIMEText
from email.mime.multipart import MIMEMultipart
from email.mime.application import MIMEApplication
client = boto3.client('ce')
Below creates a list of tags and gets the data from the AWS cost explorer module for the last month.
tag_list = ["Pandorra Service","Web Service","Monitoring Service"]

now = datetime.datetime.utcnow()
 # note that end date is exclusive - meaning its data will not be included
end = datetime.datetime(year=now.year, month=now.month, day=1)
start = end - datetime.timedelta(days=1)
start = datetime.datetime(year=start.year, month=start.month, day=1)
start = start.strftime('%Y-%m-%d')
end = end.strftime('%Y-%m-%d')

response = client.get_cost_and_usage(
        TimePeriod={
            'Start': start,
            'End':  end
        },
        Granularity='MONTHLY',
        Metrics=['BlendedCost'],
        GroupBy=[
            {'Type': 'TAG','Key': 'Role'},
            {'Type': 'DIMENSION', 'Key': 'SERVICE'}
            ],
        Filter={ 'Tags': {
                   "Key": "Role",
                   "Values":tag_list
                   }

               }
        )
Building a dataframe out of the result:
tags = []
resources = []
costs = []

for project in response["ResultsByTime"][0]["Groups"]:
    tags.append(project['Keys'][0].replace('Role$',''))
    resources.append(project['Keys'][1])
    costs.append(project['Metrics']['BlendedCost']['Amount'])

dataset = {
    'AWS Tag': tags,
    'AWS Resource': resources,
    'Blended Cost': costs}

df = pd.DataFrame.from_dict(dataset)
df['Blended Cost'] = df['Blended Cost'].astype(float)
My dataset is ready.
I will need this function to calculate total AWS resources cost
def return_total_cost(df):
    df_total = df['Blended Cost'].sum().round(3)
    result = '{} usd'.format(df_total)
    return result
Run the function
total_month_cost = return_total_cost(df)
Data Visualization
I will create a function that creates a bar chart using data from my dataframe. I will need two aggregations: one by Resource and another by Tag.
The visualization tool that I will use is image-chart.com which positions themselves as the Google Charts API replacement (which was deprecated a few years ago).
The image-chart.com API allows you to build a URL, that can be used by your HTLM code to produce an image chart. It's very simple and easy although the colors and visualizations aren't quite appealing as for instance plotly. I love plotly visualizations, but I can't figure out how to send a plotly graph in the email body from a serverless environment, like Glue, where you can't have intermediate files saved on disk. If you happen to know how to make it - please post a comment and that will make me very happy.
Anyways, until someone figures that out, I am using image charts.
Bar chart has the following parameters:
- cht=bvg - type of the chart: vertical bar chart
- chs=700x400 chart size
- chv t: list of values that make your chart, separated by |
- chdl: List of labels, separated by |
- chds=a enables automatic scaling
Note, if you want to loop over a dataframe:
- Glue Python job you will use: for index,row in dataframename.iterrows():
- Glue Spark job you will use: for index,row in dataframename.rdd.toLocalIterator(): to gather the data scattered around several nodes
def bar_totals(df,grouping_col):
    df_grouped = df.groupby([grouping_col])['Blended Cost'].sum().reset_index(name ='total_cost').sort_values(by=['total_cost'],ascending=False)
    df_grouped['total_cost'] = df_grouped['total_cost'].astype(float).round(2)
    chli = return_total_cost(df)
    chd = ''
    chl = ''
    chdl = ''
    for index,row in df_grouped.iterrows():
        chd += '{}|'.format(row['total_cost'])
        chdl += '{}({}usd)|'.format(row[grouping_col],row['total_cost'])
    bar_chart = '<p><img src="https://image-charts.com/chart?cht=bvg&chs=700x400&chd=t:{}&chdl={}&chds=a"> </p>'.format(chd[:-3], chdl[:-1])
    return bar_chart
Execute the function to generate two bar charts, first grouped by AWS resource and second grouped by Tag.
bar_resources= bar_totals(df,'AWS Resource')
bar_tags = bar_totals(df,'AWS Tag')
The above function execution bar_totals(df,'AWS Tag') generates the following string:
'<p><img src="https://image-charts.com/chart?cht=bvg&chs=700x400&chd=t:292.62|98.62|31.&chdl=Web Service(292.62usd)|Pandorra Service(98.62usd)|Monitoring Service(31.94usd)&chds=a"> </p>'
And you can see it below as pure HTML (right-click to check the url):
|Pandorra Service(98.62usd)|Monitoring Service(31.94usd)&chds=a)
Data Table Generation
This function will use our frame to build an HTML table containing all data:
def data_table(df):
    costs_result_table = '<table border = 1><tr bgcolor="Blue"><th>AWS Tag</th><th>AWS Resource</th><th>Blended Costs</th></tr>'
    for index,row in df.iterrows():
        costs_result_table+= '<tr><td>{}</td><td>{}</td><td>{}</td>'.format(row['AWS Tag'], row['AWS Resource'], row['Blended Cost'])
    costs_result_table+= '</table>'
    return costs_result_table
Execute the function and put the result in costs_result_tablevariable:
costs_result_table = data_table(df)
Sending out an email
Here is a function that will send my email. You need to have an SMTP server and make sure the role that AWS Glue is using has permissions to send emails through the SMTP server.
def send_email(BODY_HTML):
    SENDER = "[email protected]"
    RECIPIENTS = "[email protected]"
    RELAY = "your-smtp.com"
    SUBJECT = "AWS costs report"
    message = MIMEMultipart("alternative", None, [MIMEText(BODY_HTML, 'html', 'utf-8')])
    message['Subject'] = SUBJECT
    message['From'] = SENDER
    message['To'] = RECIPIENTS
    message['X-Priority'] = '2'
    server = smtplib.SMTP(RELAY)
    response  = server.sendmail(SENDER, RECIPIENTS.split(','), message.as_string())
    server.quit()
The final steps and email example
Create an email HTML template:
BODY_HTML = "<H1>AWS Billing Costs for period <font color='blue'>{} - {} </font></H1><br>"
BODY_HTML +="<H2>Total cost: {}<H2><br>"
BODY_HTML +="<p><table><td><font color='blue'>Breakdown by AWS service</font><br>{}</td><td><font color='blue'>Breakdown by Tag </font><br>{}</td></table></p>"
BODY_HTML +="<p><H2><font color='blue'>All Costs:</font> <H2></p><p>{}</p>"
Push all variables into the HTML email body:
BODY_HTML = BODY_HTML.format(start,end,total_month_cost,bar_resources,bar_tags,costs_result_table)

send_email(BODY_HTML)

I hope you will find the above tool useful.
Next Steps
- Learn More
About the author
 Maria Zakourdaev has been working with SQL Server for more than 20 years. She is also managing other database technologies such as MySQL, PostgreSQL, Redis, RedShift, CouchBase and ElasticSearch.
This author pledges the content of this article is based on professional experience and not AI generated.
View all my tips
Article Last Updated: 2020-01-09


