By: Sergey Gigoyan | Updated: 2020-09-16 | Comments (1) | Related: > Extended Events
Problem
SQL Server database developers would probably agree that capturing stored procedure executions can be essential in understanding what code is running. This is because capturing the procedure’s execution can be easily debugged. This, in turn, will definitely help to go into a deep dive on the application’s logic which can facilitate in bug-fixing and new development.
In a previous article, we illustrated how to capture stored procedure calls using SQL Server Profiler. While Profiler is still a very useful and effective tool for many database specialists, it is a depreciated feature according to Microsoft and it will be removed in future versions of SQL Server. Instead, Microsoft recommends using Extended Events. Thus, in this article, we are going to demonstrate how to capture stored procedure calls as we have done in the previous article, but instead of Profiler we will use Extended Events. This material can be helpful especially for those who are used to using Profiler and now are looking at moving to Extended Events.
Solution
Well, our task is to easily capture SQL Server stored procedure calls for debugging. We just need to track a specific procedure call and nothing more. We will avoid collecting additional, unnecessary data and, therefore, we will choose an option that best suits our needs and captures only our problem-related information.
In the previous article, we solved the same problem using SQL Server Profiler’s Tuning template. We are going to choose a similar method while using Extended Events. Extended Events is a lightweight performance monitoring system aimed at collecting data for monitoring and troubleshooting SQL Server problems. Moreover, Extended Events is quite flexible and allows us to collect only minimal data which is enough for monitoring and analyzing the problem. Discussing Extended Events in detail is a wide topic and is out of scope of this article. Here, we are just going to use this for capturing stored procedure calls.
So, let’s create a test environment:
USE master
GO

CREATE DATABASE TestDB
GO

USE TestDB
GO

CREATE TABLE TestTable
(
  ID INT PRIMARY KEY,
  Val CHAR(1)
)
GO

INSERT INTO TestTable(ID, Val)
VALUES (1,'A'),(2,'B'),(3, 'C')
GO
We will also create a simple stored procedure that adds data into our TestTable:
CREATE PROCEDURE uspInsertData
   @pID INT,
   @pVal CHAR(1),
   @ResCode VARCHAR(10) OUTPUT
AS
BEGIN
   BEGIN TRY

      BEGIN TRANSACTION

      INSERT INTO TestTable(ID, Val)
      VALUES (@pID, @pVal)

      COMMIT

      SET @ResCode='OK'

   END TRY
   BEGIN CATCH

      IF @@TRANCOUNT > 0
         ROLLBACK

      SET @ResCode='Error'

   END CATCH

END
GO
Now, let’s open SQL Server Management Studio (SSMS) and start.
We can locate Extended Events under Management. We can create an Extended Events session with the GUI using either New Session Wizard or New Session. We can find both by right-clicking on Sessions under Extended Events:

We will choose New Session Wizard to create our Extended Event session. We click Next on the Introduction window and move to the next window:

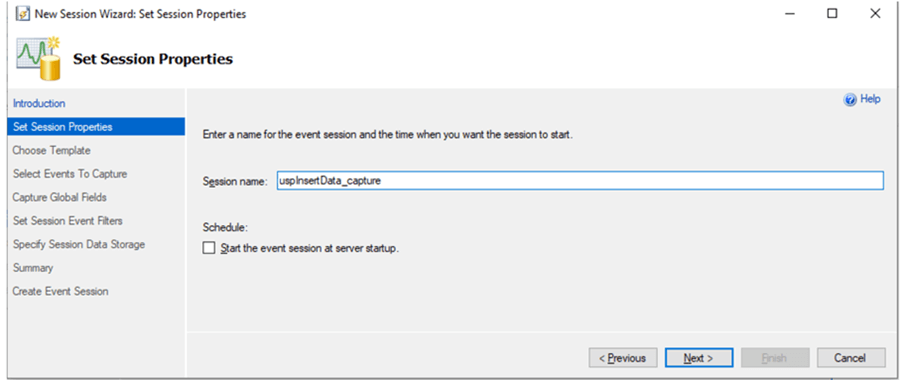
Here, we choose a name for our session and move forward:

On the next window, we have an option to choose a predefined template for the event. As we can see, among these templates, there are Profiler equivalent templates. As this article is mainly aimed at those who are going to replace Profiler with Extended Events, these are exactly what we are looking for:

We will choose the Tuning template like we did in the previous article while working with Profiler:

It is worth mentioning that it is possible to capture stored procedure calls using other templates as well. However, I prefer this template as it contains minimal events related to stored procedure calls. As we can see on the right side of the next page, there are only events selected by default in this template:

We can add and remove events using the right and left arrows between the Event Library and Selected Events. We leave it as is and move forward to the next screen where we can pick global fields we want to capture:

We will not change anything here and move forward.
On this page, it is important to set the right filter to capture only our stored procedure call. We add a filter and as a field choose sqlserver.sql_text and like_i_sql_unicode_string as the operator. As the value we choose our stored procedure (or part of its name) included in ‘%’ signs as we do when using the T-SQL Like operator:

We do not specify any data storage on the next screen and will move to the Summary page:

On the summary page, we can generate our event session creation script by clicking Script on the bottom-right corner:

We can see the event’s T-SQL script:

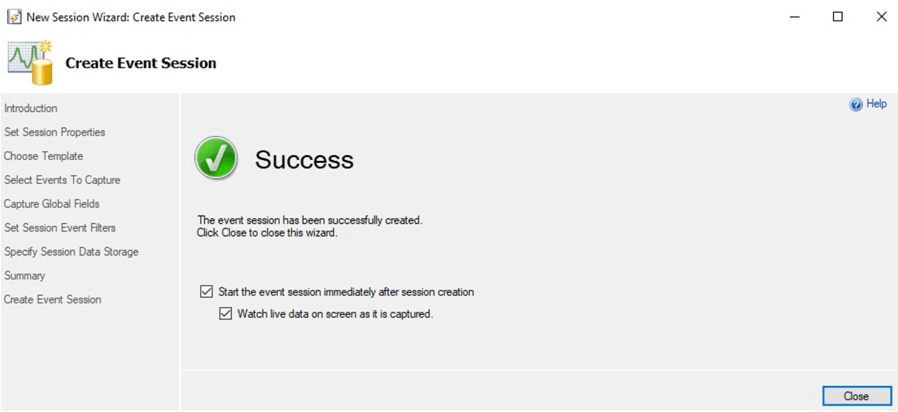
After clicking Finish, we successfully create the event session:

We can find our session under Management > Extended Events > Sessions:

Now, let’s execute our stored procedure and see what happens:
USE TestDB
GO

DECLARE @ResCode varchar(10)

EXEC uspInsertData
  @pID = 4,
  @pVal = N'D',
  @ResCode = @ResCode OUTPUT

SELECT @ResCode as N'@ResCode'
GO
As we can see, the procedure’s call is captured. We can see the execution code of the procedure in the batch_text field:

If we double-click on that field, we can easily copy the code and paste it into a SSMS query window for debugging. To edit the session, we can right-click on that session in SSMS under Management > Session and change options:

As you can see, capturing stored procedure calls with the extended events is simple process and hopefully it will not be difficult for users who used Profiler for many years to feel comfortable with Extended Events as well.
Conclusion
Extended Events can effectively be used for capturing stored procedure calls. There are also special templates similar to SQL Server Profiler’s templates that facilitate the work of those who have worked with Profiler. Considering the fact that Microsoft mentions that Profiler will be removed in future versions of SQL Server, it is important to practice using Extended Events for solving the problems which we used to handle with Profiler.
Next Steps
Please find additional information about the discussed topic by following the links below:
- Quickstart: Extended events in SQL Server
- Use the SSMS XEvent Profiler
- SQL Server Profiler
- Using SQL Server Profiler to Capture Stored Procedures Executions
About the author
 Sergey Gigoyan is a database professional with more than 10 years of experience, with a focus on database design, development, performance tuning, optimization, high availability, BI and DW design.
This author pledges the content of this article is based on professional experience and not AI generated.
View all my tips
Article Last Updated: 2020-09-16


