By: Fikrat Azizov | Updated: 2020-10-05 | Comments (2) | Related: > Azure
Problem
I was helping with developing a Spark solution to handle IOT data from sensors for one of my customers and came across a problem which took me a while to solve. This problem was related to the functionality limitation on Apache Spark streaming. I would like to describe it here, as well as a solution for the benefit of other developers.
Solution
Overview of Spark structured streaming and its limitations
Spark streaming is an extension of Spark API's, designed to ingest, transform, and write high throughput streaming data. It can consume the data from a variety of sources, like IOT hubs, Event Hubs, Kafka, Kinesis, Azure Data Lake, etc. While for Spark streams may look as a continuous stream, it creates many micro-batches under the hood, to mimic streaming logic. In other words, Spark streaming offers near-real time processing capabilities. On top of its ability to consume live data, the Spark streams allow you to ingest relatively static data, for example, data residing in the files within Blob Storage.
The nice thing about Spark stream API's is that they have been implemented the same way the other Spark API's implemented, both from read/write and transformations standpoint. In other words, once you created a data frame using streaming API's, you can apply the same set of transformations to it. Spark streaming supports wide range of transformations, like joins, calculated columns, aggregations, etc. However, not all transformations that could be applied to a static data frame, can be applied to the streaming data frames. One of these limitations is a pivoting transformation, which I am going to describe here.
Use Case Scenario
The data coming from IOT devices is typically in a JSON format, with device specific data (like device name, location, etc.), the event timestamp, and number of measurements. Depending on the device configuration, the measurement data set may be represented in horizontal (where each measure name is a separate column), or vertical (represented as a key/value pair) shape. While handling horizontal data is easier, vertical data format may involve extra transformations, like pivoting. I will be focusing on the vertical data format scenario, for the rest of this tip.
I've used open-source weather data, applied minor transformations to it and converted it to JSON data with the vertical shape, where all of the measures generated by the same station at the same time are included as the series of key/value pairs, here's an example :
[{"STATION":"USW00013743","NAME":"WASHINGTON REAGAN NATIONAL AIRPORT, VA US","EVENT_TIME":"2014-12-25T19:00:00",
"SERIES":[{"MEASURE":"HLY_CLDH_NORMAL","VALUE":-7.777000000000001e+002},
{"MEASURE":"HLY_CLOD_PCTBKN","VALUE":1.570000000000000e+002},
{"MEASURE":"HLY_CLOD_PCTCLR","VALUE":2.080000000000000e+002},
{"MEASURE":"HLY_CLOD_PCTFEW","VALUE":1.530000000000000e+002},
{"MEASURE":"HLY_CLOD_PCTOVC","VALUE":4.190000000000000e+002},
{"MEASURE":"HLY_CLOD_PCTSCT","VALUE":6.300000000000000e+001}],
{"STATION":"USW00013743","NAME":"WASHINGTON REAGAN NATIONAL AIRPORT, VA US","EVENT_TIME":"2014-12-25T19:00:00",
"SERIES":[{"MEASURE":"HLY_CLDH_NORMAL","VALUE":-7.777000000000001e+002},
{"MEASURE":"HLY_CLOD_PCTBKN","VALUE":1.570000000000000e+002},
{"MEASURE":"HLY_CLOD_PCTCLR","VALUE":2.080000000000000e+002},
{"MEASURE":"HLY_CLOD_PCTFEW","VALUE":1.530000000000000e+002},
{"MEASURE":"HLY_CLOD_PCTOVC","VALUE":4.190000000000000e+002}]}]
My goal here is to convert this data into the following horizontal format:

Prepare Spark environment for code execution
To demonstrate the problem with pivoting transformations, I have created a PySpark notebook. You'll also needs a data file in gzip format. Please download the files included in this tip and unpack it.
Next, upload that notebook Pivoting with spark streaming.dbc into your Databricks workspace (see this article for more details) and upload the gzip file into Databricks' file system (DBFS), using Data/Add Data commands (you can learn more on uploading files into DBFS here).
Once uploaded, the file will be accessible in the folder /FileStore/tables/.
Let me walk you through the commands in that notebook.
The first command imports the pyspark libraries required later, using the below code:
from pyspark.sql.types import *
from pyspark.sql.functions import *
The next command initializes source/destination variables and determines a JSON schema definition:
srcFilePath="/FileStore/tables/WASHINGTON_WEATHER_JSON3_csv.gz"
dstFilePath="/FileStore/weather/WASHINGTON_WEATHER_JSON.parquet"
payloadStruct=(StructType()
               .add("STATION",StringType())
               .add("NAME",StringType())
               .add("EVENT_TIME",StringType())
               .add("SERIES",ArrayType(StructType()
                       .add("MEASURE",StringType())
                       .add("VALUE",StringType()))))

payloadSchema=StructType ([StructField("EVENT_PAYLOAD",payloadStruct, True)])
csvSchema=StructType ([StructField("json_msg",StringType(), True)])
jsonSchema=ArrayType(StructType().add("STATION",StringType())
                     .add("NAME",StringType()).add("EVENT_TIME",StringType())
                     .add("SERIES",ArrayType(StructType()
                            .add("MEASURE",StringType())
                            .add("VALUE",StringType()))))
The next command reads the gzip file and converts it into Databrick's delta format:
(spark.read.csv(srcFilePath,header=True,schema=csvSchema,sep='|',escape= "\"")
 .withColumn('EVENT_PAYLOAD_ARR',from_json(col('json_msg'),jsonSchema))
 .withColumn('EVENT_PAYLOAD',col('EVENT_PAYLOAD_ARR')[0])
 .select('EVENT_PAYLOAD')
 .coalesce(1)
 .write
 .format('delta')
 .mode('append')
 .save(dstFilePath))
Note that, I have used from_json function and the schema variable prepared earlier, to unpack JSON content in the above command.
As I mentioned earlier, Spark streams can read from static files, so my next command reads the file prepared by the previous step, as a stream and extracts its content:
dfStm=(spark.readStream
.option("maxFilesPerTrigger", 1)
.option("quote", "\"")
.format('delta')
.load(dstFilePath)
.withColumn('SERIES_ARR',explode(col('EVENT_PAYLOAD.SERIES')))
.withColumn('STATION',col('EVENT_PAYLOAD.STATION'))
.withColumn('NAME',col('EVENT_PAYLOAD.NAME'))
.withColumn('EVENT_TIME',col('EVENT_PAYLOAD.EVENT_TIME').cast('timestamp'))
.withColumn('MEASURE',col('SERIES_ARR.MEASURE'))
.withColumn('VALUE',col('SERIES_ARR.VALUE').cast('float'))
.select('STATION','NAME','EVENT_TIME','MEASURE','VALUE')
      )
display(dfStm)
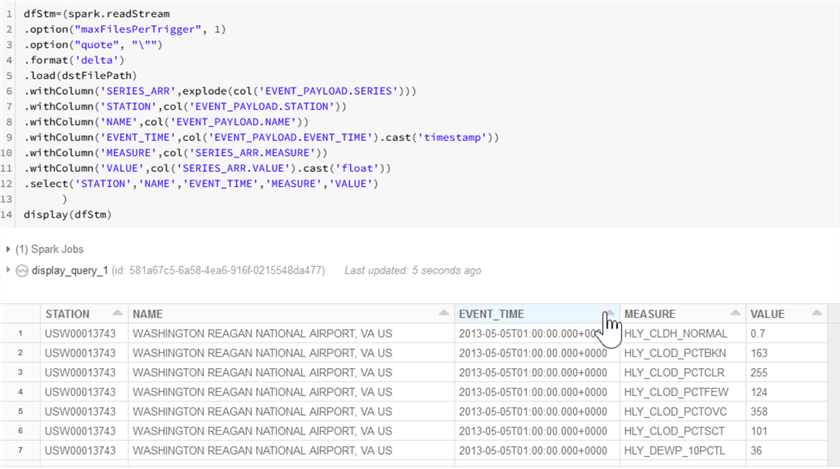
Note that I used spark.readStream command to indicate that the resulting data frame needs to be a streaming data frame. Another thing to note that I've applied the explode method, to flatten the 'Series' section of JSON payload. As you can see from the sample output provided below, dfStm data frame contains a tabular data with the vertical shape:

Incorrect way to Pivot Data with Spark
Let us first try applying pivoting to the above data frame directly, using the below code:
(dfStm.groupBy('STATION','NAME','EVENT_TIME')
 .pivot('MEASURE')
 .sum('VALUE')
 .writeStream
 .option('checkpointLocation',"dbfs:/FileStore/stream_chekpoint/")
 .format('delta')
 .outputMode('complete')
 .start('/FileStore/delta/WeatherPivoted/'))
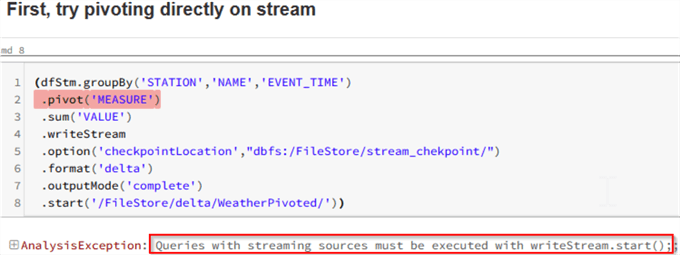
As you can see from the below screenshot, this command fails with some vague message, 'Queries with streaming sources must be executed with writeStream.start()':

Note that Spark has highlighted the row with the pivoting transformation.
Pivot Data with Spark using a Batching Approach
I think the pivoting transformation in the above sample failed, because Spark streams do not support pivoting applied directly to the streaming data frame (although I was not able to find any references to that in the online Spark sources).
Instead, we will use the foreachBatch method, in combination with a user defined function, which will perform pivoting. Here's the function's code:
def forEachFunc(df,batch_id):
   (df.groupBy('STATION','NAME','EVENT_TIME').pivot('MEASURE').sum('VALUE')
   .withColumn('ProcessedTime',current_timestamp())
   .write.format('delta').mode('append')
   .save('/FileStore/delta/WeatherPivoted/'))
   pass
Note that this function adds processing timestamp and saves the results into another location in delta format, in addition to pivoting. And here is the parent code which will leverage the batching approach:
(dfStm.writeStream
   .trigger(processingTime='1 seconds')
   .option('checkpointLocation',"dbfs:/FileStore/stream_chekpoint2/")
   .foreachBatch(forEachFunc).start())
Note that with the new approach we have also used a trigger method to specify the batching frequency.
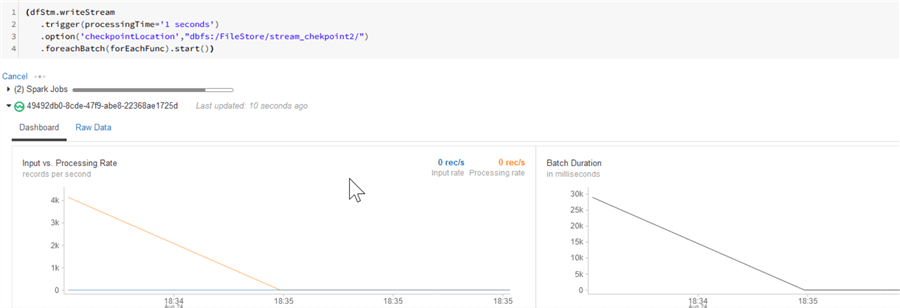
As you can see from the output below, this approach worked!

However, we still have a problem- the results produced by this pivoting may contain duplicates (i.e. rows with the same set of key fields 'STATION','NAME','EVENT_TIME'), because we've instructed Spark to batch the input data on a certain frequency (1 sec in this case), which may result in rows logically belonging to the same measure set being end up in different batches. So, to ensure that all the measures related to the same key field combination is processed together, let us remove the flattening transformation (explode) from our dfStm data frame, as follows:
dfStm=(spark.readStream
.option("maxFilesPerTrigger", 1)
.option("quote", "\"")
.format('delta')
.load(dstFilePath)
.withColumn('STATION',col('EVENT_PAYLOAD.STATION'))
.withColumn('NAME',col('EVENT_PAYLOAD.NAME'))
.withColumn('EVENT_TIME',col('EVENT_PAYLOAD.EVENT_TIME').cast('timestamp'))
.withColumn('SERIES',col('EVENT_PAYLOAD.SERIES'))
.select('STATION','NAME','EVENT_TIME','SERIES')
      )
display(dfStm)
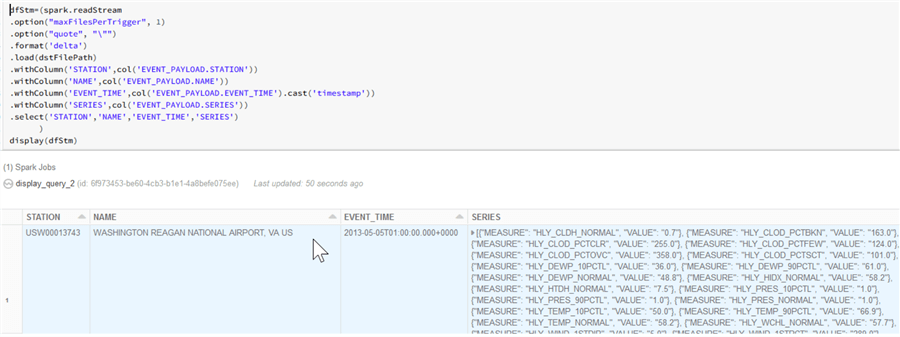
As you can see from the screenshot below with the results, this time the 'Series' field contains all of the measures related to the same station/timestamp:

Next, let us add flattening logic inside the forEachFunc function, as follows:
def forEachFunc(df,batch_id):
  df=(df.withColumn('SERIES_ARR',explode(col('SERIES')))
  .withColumn('MEASURE',col('SERIES_ARR.MEASURE'))
  .withColumn('VALUE',col('SERIES_ARR.VALUE').cast('float')))

  (df.groupBy('STATION','NAME','EVENT_TIME')
   .pivot('MEASURE').sum('VALUE')
   .withColumn('ProcessedTime',current_timestamp())
   .write.format('delta')
   .mode('append')
   .save('/FileStore/delta/WeatherPivoted3/'))
  pass
Finally, let us start the stream using the code we ran earlier:
(dfStm.writeStream
   .trigger(processingTime='1 seconds')
   .option('checkpointLocation',"dbfs:/FileStore/stream_chekpoint4/")
   .foreachBatch(forEachFunc).start())
Let us create a delta table, which can help us to browse the results, using the below code:
%sql
create table if not exists WeatherPivoted
USING DELTA
Location '/FileStore/delta/WeatherPivoted3/';

select * from WeatherPivoted order by STATION,NAME,EVENT_TIME
Finally, here is the screenshot with the correct results:

Conclusion
Based on what was discussed here, some of the limitations of streaming data frames could be addressed by applying the foreachBatch method. As mentioned earlier, I was not able to find a comprehensive list of transformations which can't be applied to Apache Spark streaming data frames in online sources, so if you come across such a list please share your findings, it'd be greatly appreciated.
Next Steps
About the author
 Fikrat Azizov has been working with SQL Server since 2002 and has earned two MCSE certifications. He’s currently working as a Solutions Architect at Slalom Canada.
This author pledges the content of this article is based on professional experience and not AI generated.
View all my tips
Article Last Updated: 2020-10-05


