By: Scott Murray | Updated: 2020-12-28 | Comments (2) | Related: > Power BI
Problem
What many SQL Server Professionals do not realize is that relationships can be created in the Power Query Editor via the Merge function. In addition to joining data horizontally, we can also union two datasets via the Append function, which adds additional rows to a dataset. In this tip we will cover how to use merge and append in Power BI.
Solution
Often SQL Server Professionals consider Power BI to be a reporting or dashboard tool, but it really encompasses a full reporting solution including modeling and import capabilities.
As part of the modeling process, one of the main ways to establish and maintain relationships is via the DAX relationship manager on the design grid. However, these relationships have several restrictions including that the relationship is generally what most SQL Server Professionals would consider to be an inner join and only a single field can be used to link the tables together in the relationship. There are certainly methods to navigate around these restrictions. Of course, the ability to use bi-directional filtering (similar to the concepts used in SQL Server Analysis Services and addressed in this tip: Bi-Directional Cross-Filtering in Analysis Services Tabular 2016 for Dynamic Row Level Security) is a positive for these type of relationships.
Relationships can be created in the Power Query Editor via the Merge function. In addition to joining data horizontally, we can also union (using SQL term which performs a similar function) two datasets via the Append function, which adds additional rows to a dataset. In addition to simple merge and append, we will discuss some of the extended functions written in M that can extend the usefulness of these functions.
Letís see how we can use merge and append to make joining datasets a better outcome. However, before we get into the examples, you need to be sure to download the latest version of Power BI desktop..
Due to the nature of this particular tip, we are using a different data source from the traditional Wide World Importers SQL Server sample database. Instead, we are using zip code and city name lists from Simple Maps. Getting a postal code list from Canada proved to be more difficult, and I ended up creating a random list on my own based on some data from Post Canada. The format of the zip and postal code lists are different, which is a great test case for using append.
Append Queries in Power BI
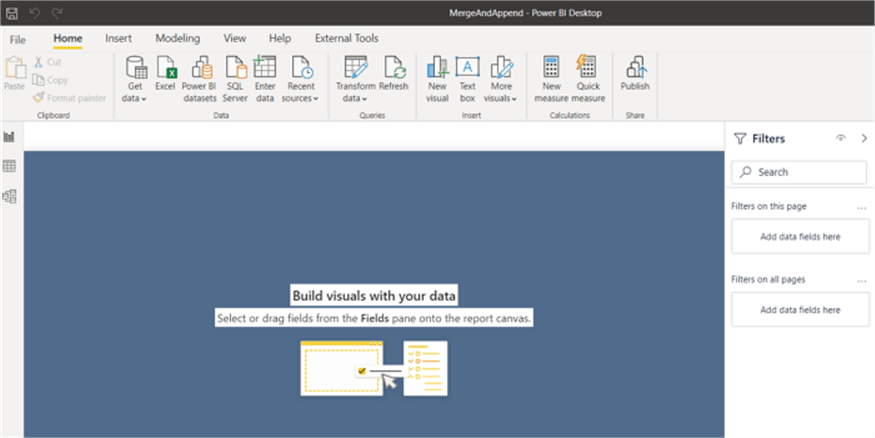
To get started, we will create a simple PBIX Power BI report file; we will be working exclusively in the Power Query Editor. No visuals will be added.
Next, we will go to the Power Query Editor to start working with the datasets. Our first step will be working with the append function. In particular, the Canadian Forward Sortation Area list will be appended to the USA zip code list. The append will be completed via the GUI.
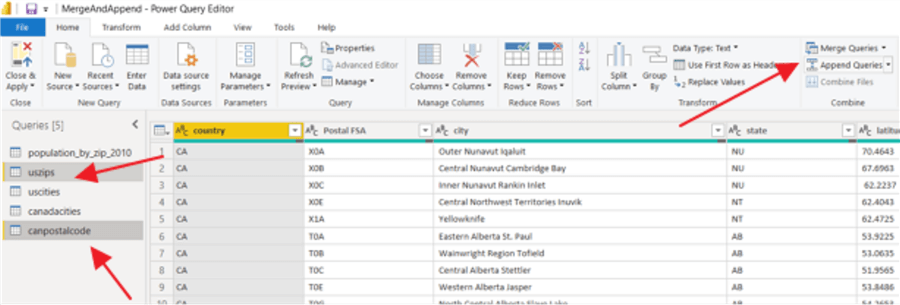
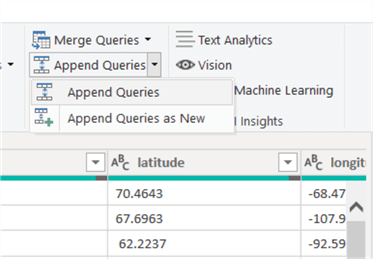
TTo append multiple datasets, first select the dataset from the Queries list in the left column. Next, select the Append Queries option. You can either append the first query to the second query and retain the name, or you can create a new query.
As you can see in the below illustration, the dialog box allows for the selection of two or three or more tables.
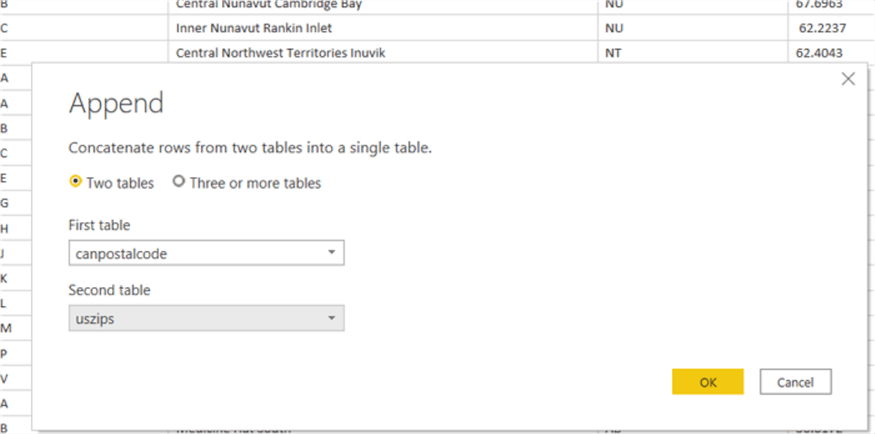
Thus, the canpostalcode dataset is the initial or first table upon which the uszips table is added to the bottom of. If any of the column names match, that field will be conveyed to a single column in the combined or new table. If the query column names do not match, then that column is added to the appended table with data from the column that has data and with null values for the 2nd (and 3rd,, etc.) dataset. As you can see in the below example, the left 3 columns come from the Canada Forward Sortation Area table while the next 4 come from the US Zip code table. Since the names do not match, you will also notice that both queries have latitude and longitude. However, four separate columns were created (two from each table).

We have a few options to get the append to match up the columns. The most efficient way is to rename the columns in each table to match exactly. In the below example, the field names for Postal Code, City, State Abbreviation, Latitude, and Longitude are standardized.

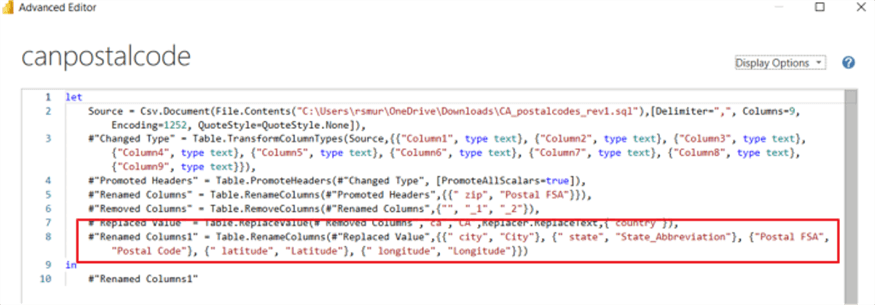
NNow that the names are the matched up, we can see the data from each dataset is "stacked" together while any field not matching between the two datasets are still added. But they are kept separate by using nulls for the column values where the field does not exist.

Finally, when using append, we can actually specify the columns that will be included in the append function by listing out the columns to be included. As shown below, the list of columns/field is included after the table names and each field is enclosed in double quotes and the entire list enclosed in curly brackets. Each of these changes is completed by clicking on the advanced editor and manually adding the field names.

As illustrated below, the appended dataset now only includes the columns listed in the Table.Combine function.

Even if a field is not in all the tables to be combined, it still can be added to the column / field list. In the below example, country is added to the field list, yet it only exists in the Canadian Postal Code list.

In the below image, the country is shown for the Canadian Postal code data rows while showing null for the US Zips rows.

If there are more than two query datasets to be appended together, they can simply be added to the list as shown below.

Power BI Merge Queries
SSo far in this tip, we have covered the append or stacking process for datasets. Next, the merge function will be reviewed. Whereas append works similar to the SQL union functions, the merge function works in a way similar to SQL joins. We start out the merge process using the merge button, similar to the Append process. We can merge the query datasets into the existing dataset or create a completely new dataset.

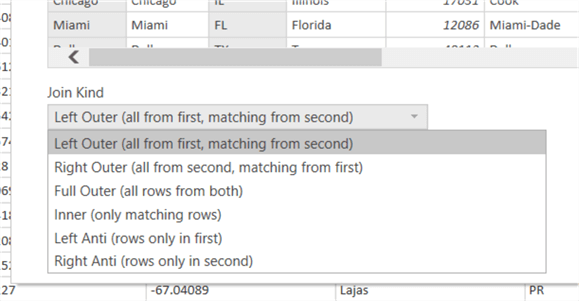
Subsequently, on the merge screen we can select the two tables involved from the drop-down list and then select the column or columns (yes multiple columns are available to join upon) which will be joined together. In the below example we are using City and State Abbreviation from the uszips table and the city and state_id from the uscities table. As you can see in the screen print, the Join Kind defaults to a left outer join, meaning all rows from the 1 st listed query (uszips) will be joined with the matching rows from the 2nd (uscities) table. Additionally, the city name and the state abbreviations are used to complete a composite key join between the two query datasets. Note, the join finds a match between 25,330 of the rows in each table.

Actually, 6 join types exist and include right and left outer joins, full outer join, inner join, and left and right anti joins. Anti joins find rows that do not match between the two query datasets.
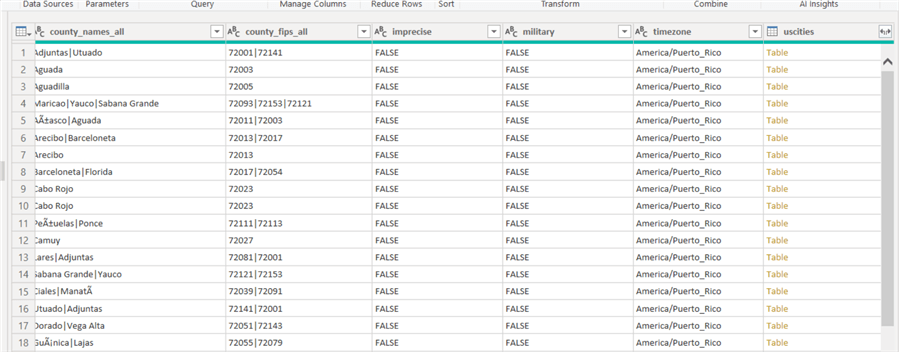
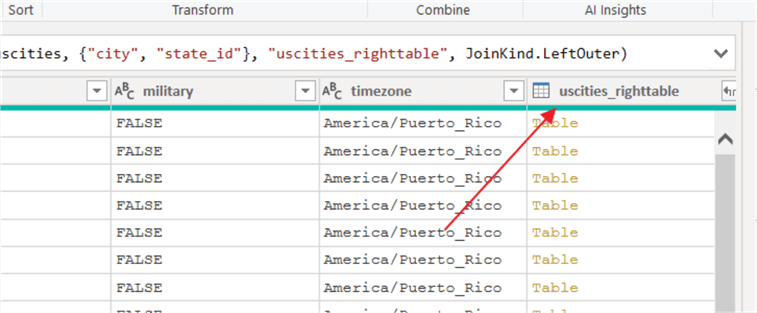
The result of the merge is shown below. A new column is added to the uszips dataset with a column name matching the 2nd table name, uscities in the below example. The data are just listed as "Table" which can be confusing.
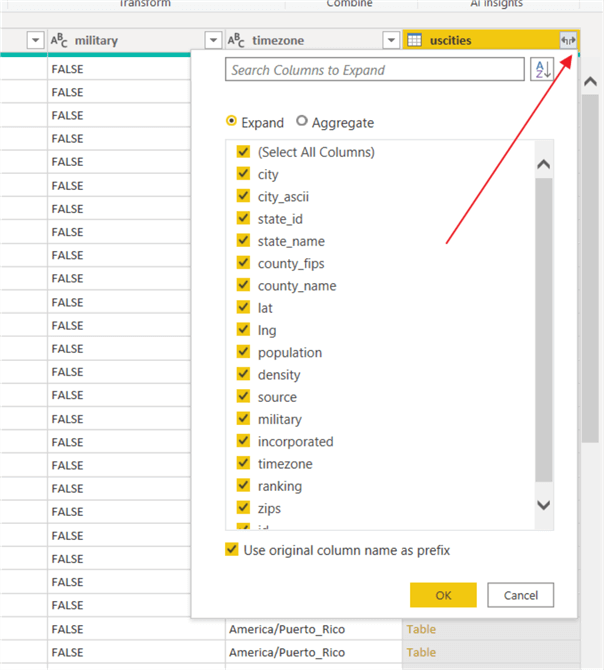
In order to see the related columns on the right-side column of the join, this column needs to be expanded using the double arrow button in the right corner of the column header. Clicking on this button opens a window that allows for the selection of specific columns from the second table that should be included in the merged dataset. Checking the Use original column name as prefix can be checked to on or off which prefixes the table name to each column.
Expanding the column adds the selected field from the right side table to the merged dataset.

Using the Advanced Editor, we can make additional modifications to the merge process. First, we can change the "column prefix" used in the column header by changing the value used in the Table.NestedJoin function, as shown below.

The result of this name change is illustrated next. The column name for the table can also be changed by double clicking on the column header.
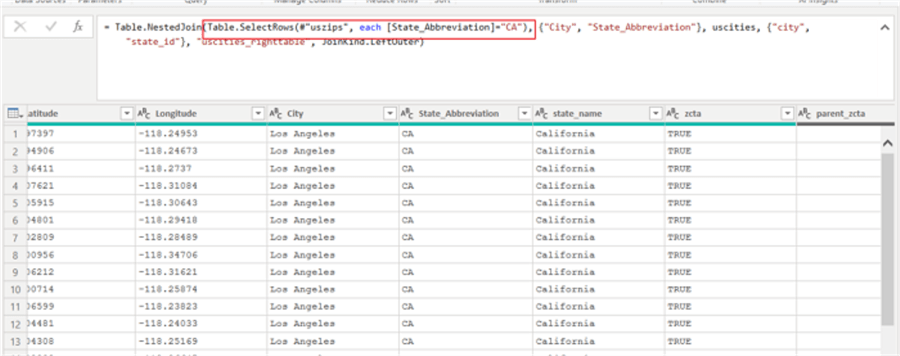
AAs part of the Merge function, we only need to pass in a table element. In the below screen print, we can actually create a table array from the uszips dataset which is filtered just to the state of CA. Now, the left part of the merge includes only rows which have a State Abbreviation of CA (as shown in the results).
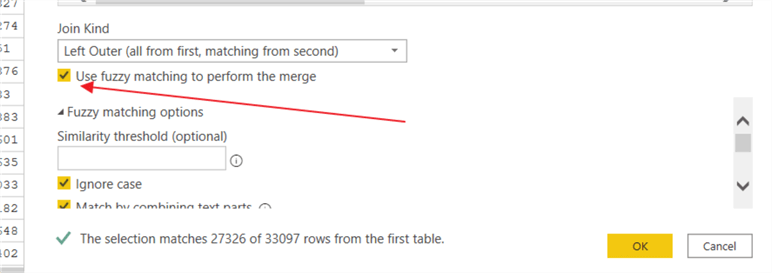
We can expand the reach of the Merge function by using the fuzzy match option. In particular, since M is case specific, I would suspect that the Ignore case option could be very handy. Notice how the match count increased in the below screen print upon using the fuzzy matching option. The similarity threshold is a range from 0 to 1 with 0.80 being default. 0 would generally mean match every row (a full outer join in SQL) whereas 1.00 would equate to match on exact matches (an inner join in SQL).
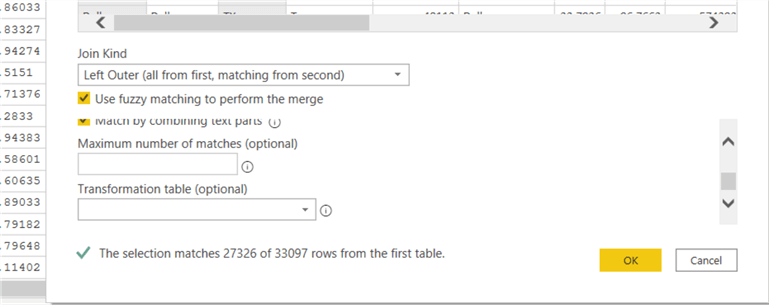
The match by combining text parts option will look at combining two text values to in an attempt to find the matching join. The combing could be items such as right-hand vs right hand, for example. The maximum number of matches option restricts the merge to the number of rows specified. For example, if during the fuzzy matching process you have two rows that could match, Power BI will pick the highest similarity score if this value is set to 1. Finally, the transformation table property allows for selecting a table to map the text values during the fuzzy matching lookup.
Upon turning on the fuzzy matching option, the options are set in the last argument in the advanced editor. Also note that the function changes from Table.NestedJoin to Table.FuzzyNestedJoin.

In this tip we have covered using the append and merge functions in the Power BI query editor to combine data from various query datasets. Both these processes provide an expanded option to combine or stack two query data sets within the query editor, with methods to achieve left, right, full, and anti joins.
Next Steps
- Check out more Power BI Tips
Learn more about Power BI in this 3 hour training course.
About the author
 Scott Murray has a passion for crafting BI Solutions with SharePoint, SSAS, OLAP and SSRS.
This author pledges the content of this article is based on professional experience and not AI generated.
View all my tips
Article Last Updated: 2020-12-28


