By: Eric Blinn | Updated: 2021-01-26 | Comments (8) | Related: > Performance Tuning
Problem
I've used STATISTICS IO to help performance tune SQL Server queries, but I focus mostly on logical reads. I see there is a lot more information in the output that I would like to understand and use for tuning queries.
Solution
The SQL Server SET STATISTICS IO ON option allows for a secondary output stream of SQL Server queries to include details about what objects were queried and to what extent. This tip will cover how to read and react to the output from STATISTICS IO.
This tip assumes a basic knowledge of what STATISTICS IO is and how to make it appear. If unfamiliar with how to view or read the output of STATISTICS IO, this tip will prepare the reader for the information in this tip.
All of the demos in this tip will use the WideWorldImporters sample database which can be downloaded for free and will be run against SQL Server 2019. The images may be different, but the methodology should still work on older versions of SQL Server.
SQL Server STATISTICS IO Example
The output of STATISTICS IO includes one row for every table that is part of a query along with a number of various types of "reads". Each "read" indicates that an 8kb data page was read by the query.
If there are multiple queries in a batch there will be multiple independent table lists.
If a table is listed in the FROM clause more than once in any given query, it shows up only once in the STATISTICS IO output for that query.
If a view is queried it will not be listed, instead, the underlying tables that make up the view will be listed.
Consider these 2 queries run as a single batch. The first queries a single object which is a view. The second uses 5 tables shown in the FROM clause, but Application.People is listed 4 times.
SELECT TOP 1 * FROM Website.Customers --This is a view

SELECT TOP 1
   si.InvoiceDate
 , ap.FullName AccountPersonName
 , cp.FullName ContactPersonName
 , sp.FullName SalesPersonName
 , pp.FullName PackedByPersonName
FROM Sales.Invoices si
INNER JOIN [Application].People ap ON si.AccountsPersonID = ap.PersonID
INNER JOIN [Application].People cp ON si.ContactPersonID = cp.PersonID
INNER JOIN [Application].People sp ON si.SalespersonPersonID = sp.PersonID
INNER JOIN [Application].People pp ON si.PackedByPersonID = pp.PersonID
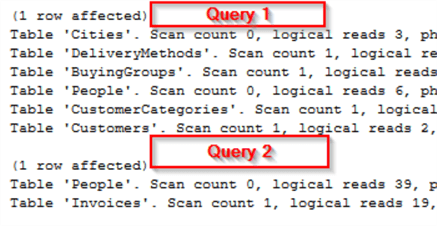
The IO stats for this query batch shows:
For the first query -- despite listing only a single object in the FROM clause -- actually lists 6 tables as having been queried as shown below.
The second query -- despite listing 5 tables -- only shows 2 tables in the output (since the People table is referenced 4 times). If you want to know how many of those 39 logical reads attributed to the People table can be assigned to each of the 4 joins, there just isn't a good way to determine that.

SQL Server Logical Reads
Logical reads are the main statistical number used by performance tuners looking at this output. They show the total number of data pages that were needed from each table to complete the query.
Seeing large numbers listed doesn't necessarily mean the query is going to be slow. But reducing them by modifying the query or index structures often leads to better query performance.
SQL Server Physical Reads
A physical read is a page of data that wasn't in the buffer pool at the time of query execution and had to be read from disk. Physical reads are a subset of logical reads. Any page of data that is read off of disk is loaded into the buffer pool so that future reads can be logical only.
This difference can be demonstrated with a query batch like the one below. The following query turns on STATISTICS IO, clears the buffer pool, then runs the same small query twice in immediate succession.
NOTE: DBCC DROPCLEANBUFFERS should only be run in an environment where performance isn't important as it flushes the entire buffer pool.
SET STATISTICS IO ON;
DBCC DROPCLEANBUFFERS;

SELECT TOP 1 InvoiceID FROM Sales.Invoices;
SELECT TOP 1 InvoiceID FROM Sales.Invoices;
The output confirms that the first query needed a to go to disk (physical reads) since the buffer pool was empty while the second query was able to rely solely on the buffer pool and needed 0 physical reads. Both queries used the same number of logical reads, 2. This confirms that physical reads are a subset of logical reads and not pages read in addition to logical page reads.

If tuning a query and a significant physical read count appears after running the query several times, it might indicate that the instance is experiencing memory pressure and is unable to keep needed data pages in the buffer pool as long as desired.
SQL Server Read Ahead Reads
Read-Ahead reads are another type of physical read where SQL Server reads data pages off of a disk and loads them into the buffer pool. Except these happen before the storage engine asks for them. The optimizer does this in scenarios where it anticipates these pages are likely to be needed by the query and it can save time by performing the reads in advance of the eventual request. These reads are not a subset of logical reads as the system can't be sure they will ever be used by the query when they are completed.
When a query is reporting read-ahead reads this might indicate memory pressure as these are physical reads, they would likely be better served as logical reads if the buffer pool already had the data pages loaded.
Neeraj Prasad Sharma wrote an entire tip dedicated to read-ahead reads and how they impact performance. It is worth a read.
LOB Reads SQL Server
LOB is short for Large OBject. Columns are considered LOBs when defined with a MAX length like VARCHAR(MAX) or VARINARY(MAX). XML and the deprecated image and text data types are also LOBs. Every LOB column is stored on pages that are separate from the rest of the table and index columns. This is how they avoid pushing a row over the 8KB size limit for a single row when loaded with huge amounts of data.
Each of the types of reads covered so far in this tip has a LOB variant which records the number of page-reads that were performed for LOB columns.
Queries that use columnstore or full-text indexes will also report LOB reads.
If a query is reporting LOB reads, treat them the same way that their non-LOB counterparts would be treated, but remember that LOB columns cannot be indexed.
Table and Clustered Index Scans in SQL Server
Along with read counts, each table will have a scan count. A scan could mean a table/cluster scan, but it could also mean that a portion of an index was scanned. The following query batch has an example of each scenario.
SELECT TaxAmount
FROM Sales.InvoiceLines
WHERE TaxAmount < 10; --NOT INDEXED

SELECT StockItemID
FROM Sales.InvoiceLines
WHERE StockItemID = 44; --INDEXED
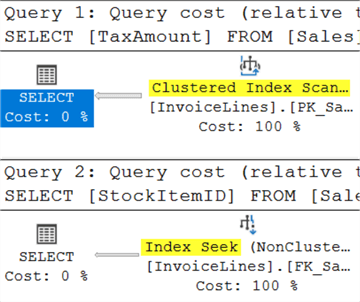
In the first query, the column being considered (TaxAmount) is not indexed. In order to run this query, an entire clustered index scan will be needed.
The second query compares against an indexed column (StockItemID). Surely the index will help the query engine quickly reach the target area where that value is stored, but the storage engine will need to scan to see if there are duplicate values nearby as the index is not governed by a unique constraint.
This screenshot of the query execution plans for the batch confirm the scan for the first query and seek for the second. But what will the IO stats record?

This screenshot of the STATISTICS IO output tells a slightly different story. It shows a scan for both queries!

This proves that a "scan" as defined by the output of STATISTICS IO does not necessarily mean a table/cluster scan. In fact, the only way to avoid a scan is to search for an exact match value on an indexed column that also has a unique constraint.
When tuning a query, a scan count of 1 should not be an immediate cause for alarm. Refer to the query execution plans for more details about what kind of scans are being performed and take action based on that output.
SQL Server WorkTable, WorkFile and TempDB
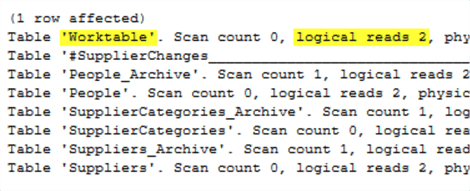
Sometimes when looking at the output from STATISTICS IO, there will be a table listed as Worktable or Workfile. This can be confusing since that definitely isn't the name of a table in the FROM clause or anywhere else in the database for that matter! When these are listed it indicates that SQL Server used, or was considering using, TempDB to temporarily store information. Often this work is an intermediate sort. The work TempDB does is recorded using Workfile and Worktable.
Consider this procedure call. The STATISTICS IO output on this author's system used 2 pages of TempDB on one of the queries.
EXEC [Integration].[GetSupplierUpdates] '1/1/2013', '12/31/2013';

Seeing evidence of TempDB usage in a query batch isn't necessarily bad. This author has seen queries where Worktable is the number one table by far. If that happens, look for anything in a query plan that looks like it is spilling to TempDB and see if statistics need to be updated to get a better plan without the spill. Also look for parts of a query that are doing TOP with an ORDER BY or DISTINCT as those operations can easily move to a worktable if there are many rows involved. Also look at if those queries can be modified to consider fewer rows before doing the sort operation.
Working with complex output from STATISTICS IO
When working with larger batches of STATISTICS IO output, the amount information can be overwhelming. If following along with the tip, the prior demo was a single line procedure call that retuned over 100 rows of STATISTICS IO output.
This author loves to use a website called StatisticsParser to help make sense of the output of STATISTICS IO and/or STATISTICS TIME. The site takes the text output and puts it into user-friendly and interactive sortable tables right in the web browser. It also puts a total for all the queries at the bottom and calculates what percentage of the overall reads each table accounts for in each query. The site works best if you include both TIME and IO STATISTICS. It is completely free and incredibly useful.
Next Steps
- A primer for using STATSISTICS IO to tune queries
- This tip tells all about read-ahead reads
- Getting statistics for SQL queries
- TSQL tuning using query statistics
About the author
 Eric Blinn is the Sr. Data Architect for Squire Patton Boggs. He is also a SQL author and PASS Local Group leader.
This author pledges the content of this article is based on professional experience and not AI generated.
View all my tips
Article Last Updated: 2021-01-26


