By: Eduardo Pivaral | Updated: 2021-08-26 | Comments | Related: > Power BI
Problem
Power BI provides a set of tools to gather, prepare and interactively visualize and share data across your organization, in an optimal, secure way. You can create reports fast and easy, with enterprise-grade quality.
What if you have time-sensitive data that you want to stream in real time for quick analysis and response? For example, IoT telemetry, social media data or other metrics that requires immediate action.
Solution
Power BI supports real-time streaming for the following types of datasets:
- Push Data
- Streaming Dataset
- PubNub streaming dataset.
In this tip we will focus on Streaming Dataset, which is the easiest way to visualize real time data using the streaming service Azure Stream Analytics job.
How it works?
Real-time data can be generated by multiple sources, but a quite common source is IoT telemetry, where you have hundreds of devices sending data, if you use Azure, to your IoT Hub.
Then this data can be collected using an Azure service called Stream Analytics job.

If you want to learn more about how to capture data using Stream Analytics jobs, you can read this tip.
A Streaming Dataset does not persist the information, so the information is only stored in cache, and depending on the volume and frequency of the information, it will only persist for a couple of hours.
Another limitation is that you cannot use custom visuals or features you normally use when building a report.
For this tip we will stream real-time IoT telemetry using Power BI.
Setup our example
We will capture telemetry data from a IoT hub solution, that will be ingested into a Stream Analytics job and later displayed in real time using Power BI.
The use of IoT hub and how to capture telemetry data is outside the scope of this tip, but you can go and read this tip as we will use a similar approach for our example.
We will have a IoT device sending temperature and humidity data to our Stream Analytics job, but you can use any source you want.
We can see that we have a device sending the information to our hub:
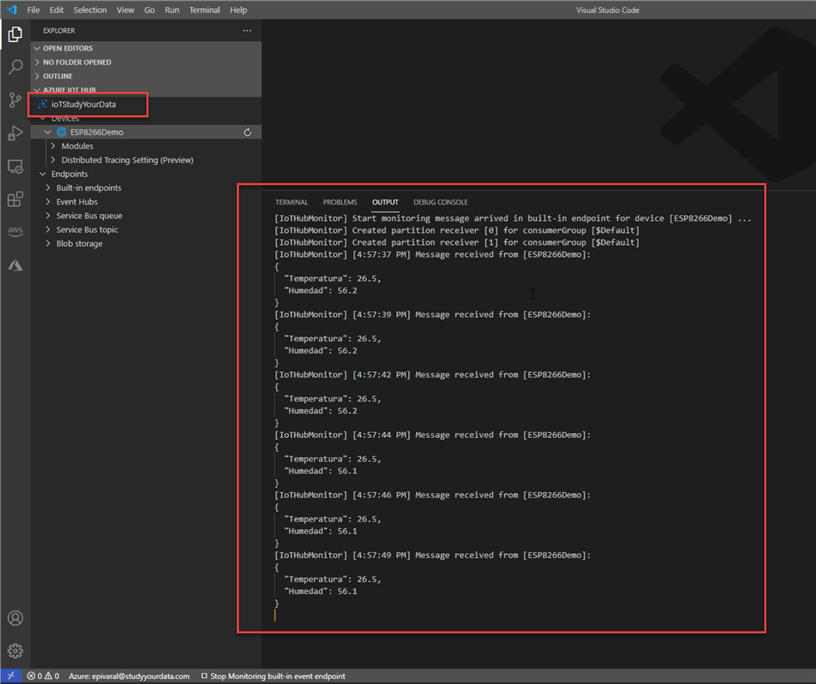
For your own tests, you can simulate devices using Microsoft device simulator, QuickStart’s or create your own input, for example from social media posts.
Also, you must have a valid Power BI account, and at least one workspace created. You can create a Power BI account at powerbi.microsoft.com.
If you want an introduction to Power BI, you can read this tip.
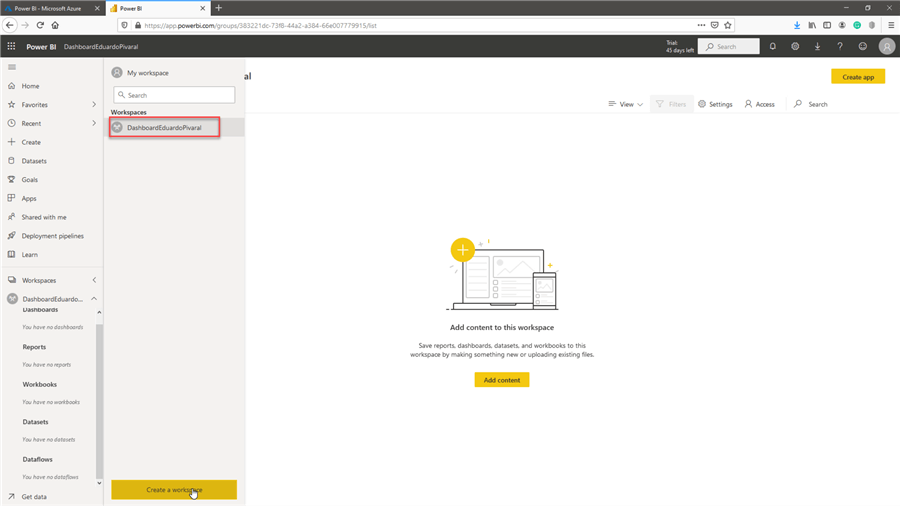
For this example, I already have a workspace created (at the moment of the writing of this tip, available with Power BI pro license, but also available on a trial period):
Configuring our Stream Analytics job
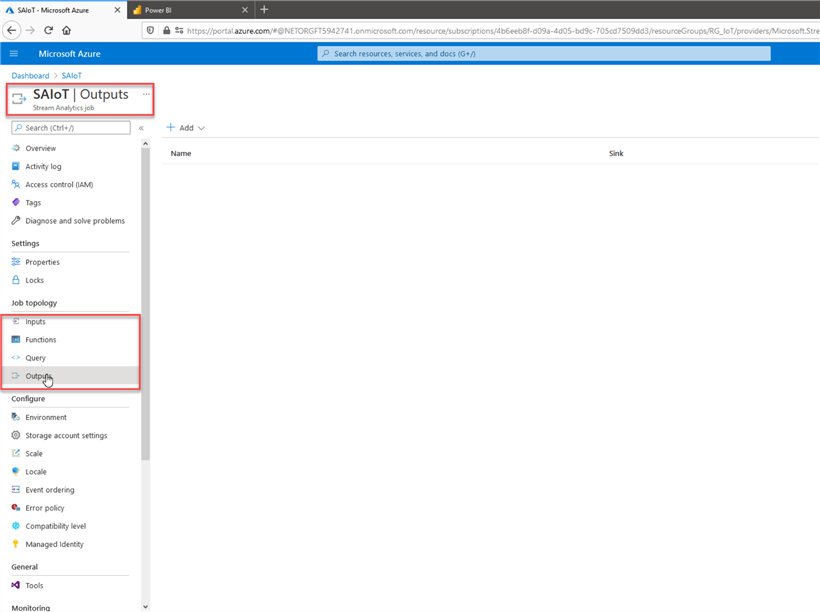
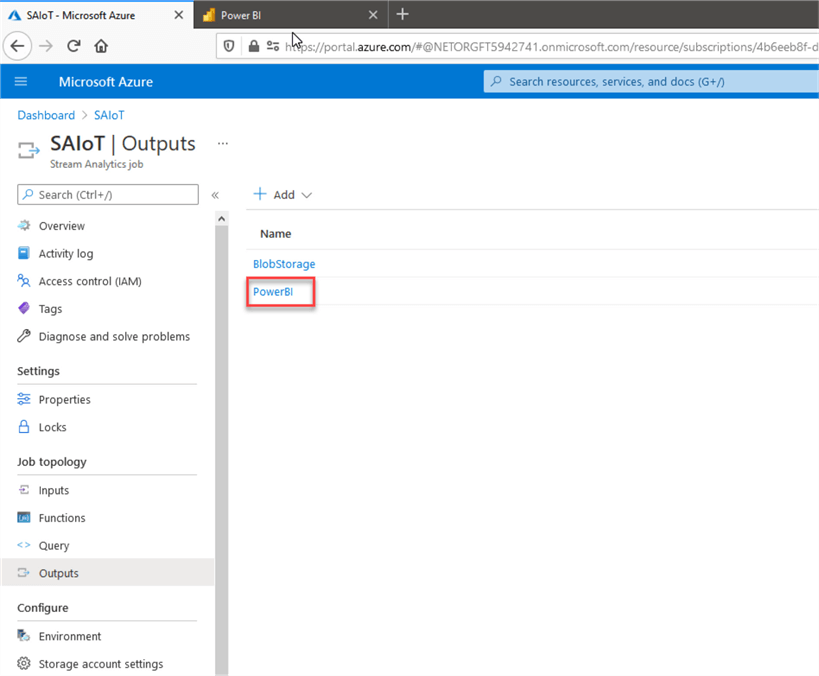
Once you have your stream Analytics job inputs configured, we proceed to create an output, for this, go to your stream analytics job, and then click on Outputs.
Next go to Add, and select Power BI.
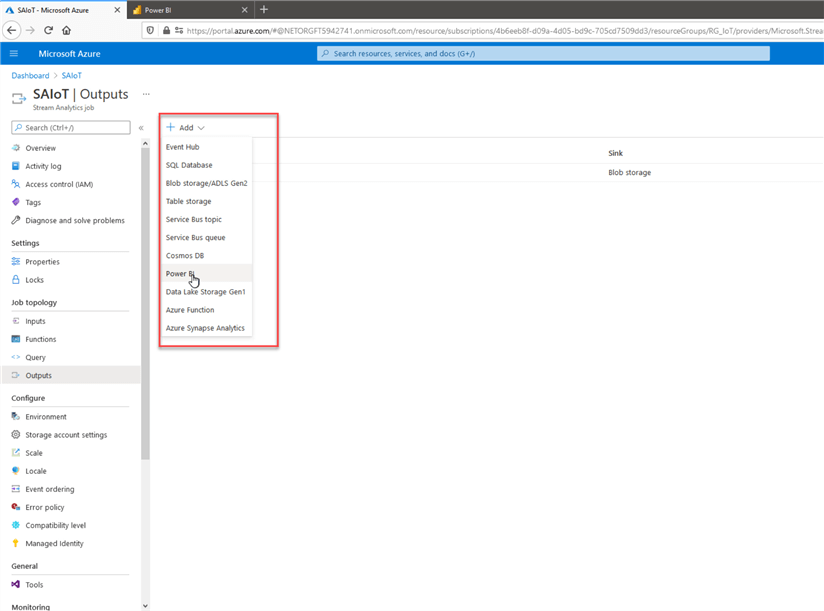
If this is the first time you are using the service, a new window will open so you can sign into your account, then a new window will appear.
In the new window put the following information:
- Output name, put a descriptive name, better if is a one-word name.
- Select the workspace to use, I will use the one I had previously created.
- For authentication mode, select user token
- Select a descriptive name for the Power BI dataset
- Select a descriptive name for the table
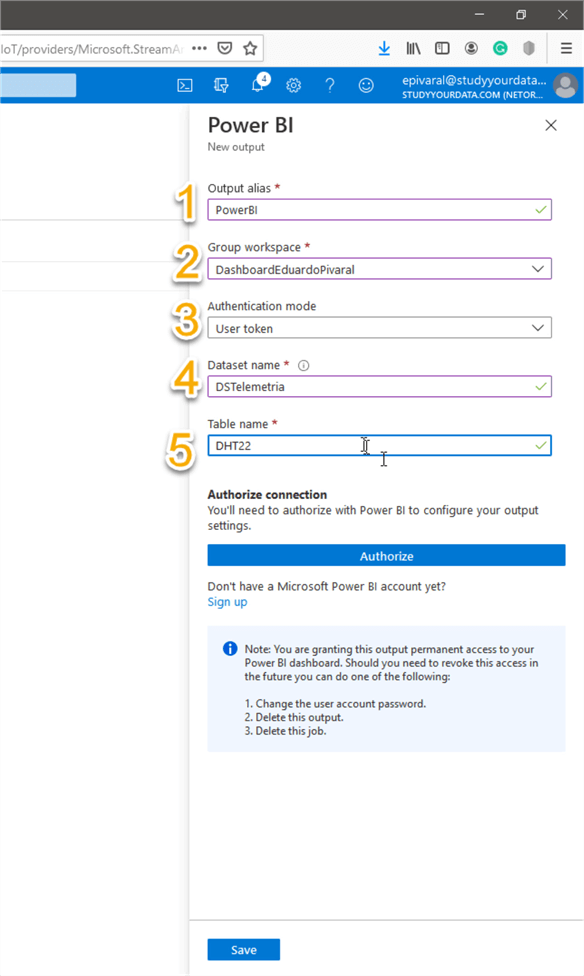
Once you are done, click on authorize, a new window will open where you must sign in again to confirm your identity.
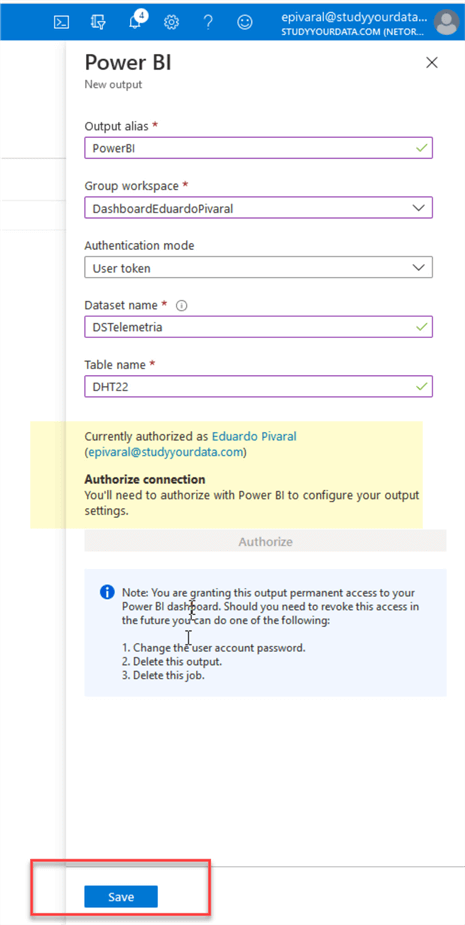
Once authorized, click on Save, and after a few seconds, you will see your output created:
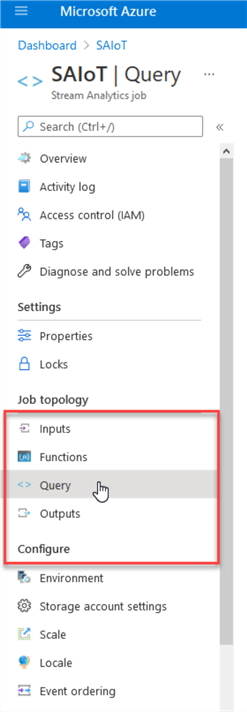
The next step is to create the query to redirect the information from the input (for our example IoT hub) to the output we just created, this is done selecting the Query section at the left:
For the query, the most basic option is to pass all information "as-is" with a basic SQL SELECT..INTO statement:
SELECT *
INTO PowerBI
FROM IoTHub
The Stream Analytics language is a subset of T-SQL and you can check the reference here. This can be used to process, filter, or group the data.
For our example we will pass all the data that is received by the hub.
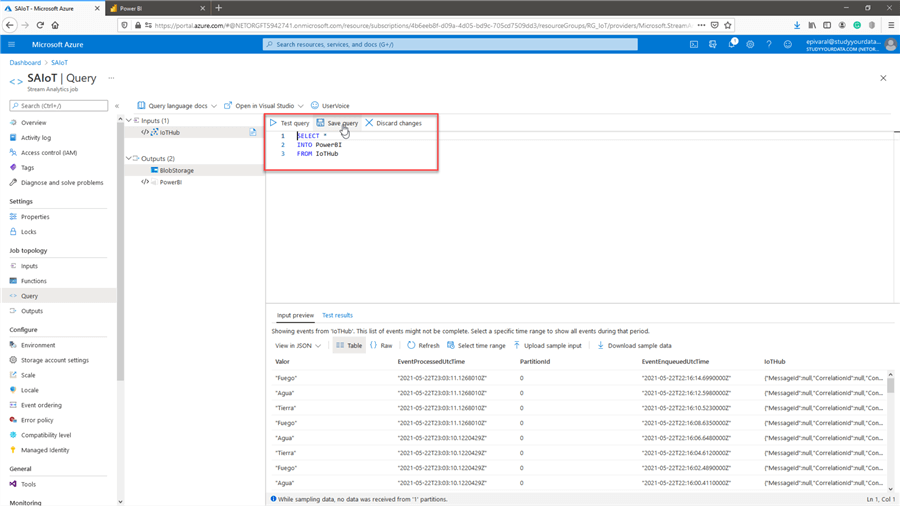
Once you have your query prepared, click on save.
The next step is to start the stream analytics job, this is done in the stream analytics dashboard:
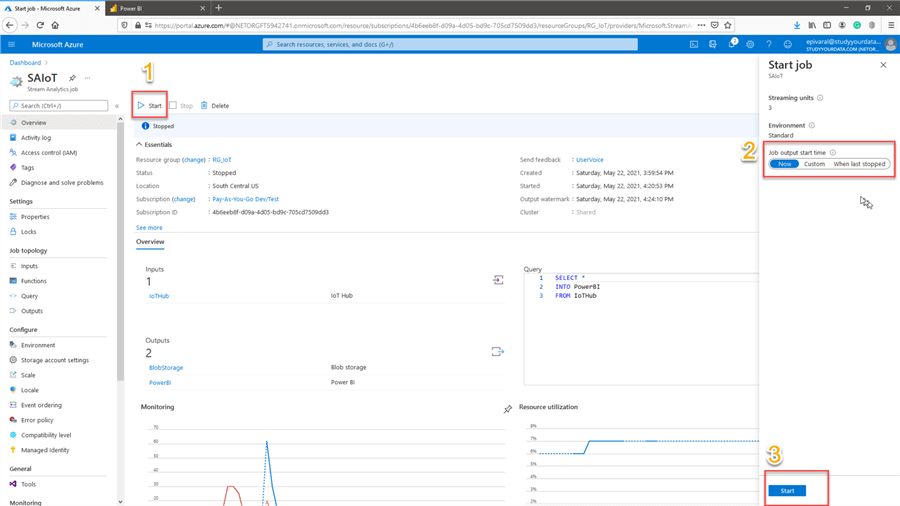
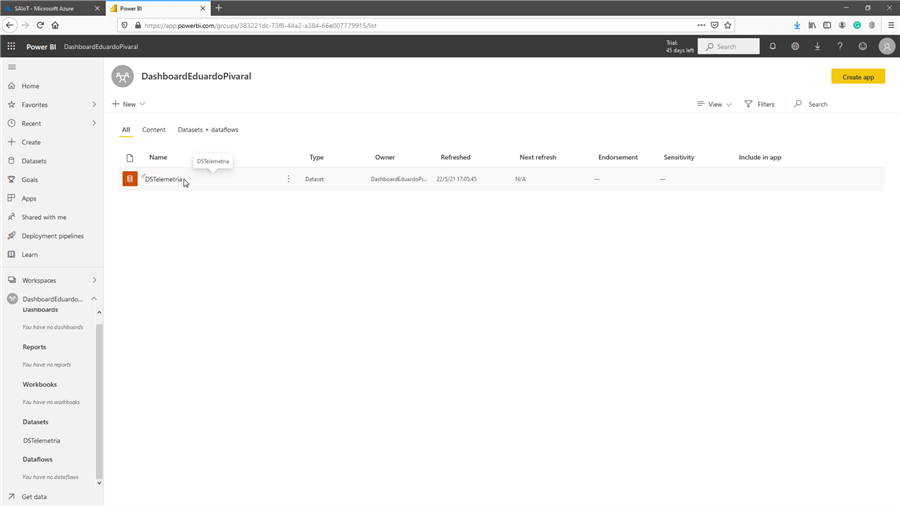
Now that the job is running and once it starts to collect data, you can go to your Power BI workspace that was created earlier, you will notice that the dataset is automatically created:
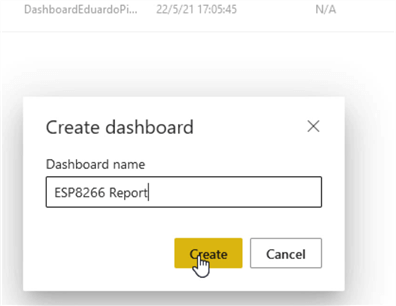
The next step is to create a visualization, for this, go to the top part of the same window and select New > Dashboard.
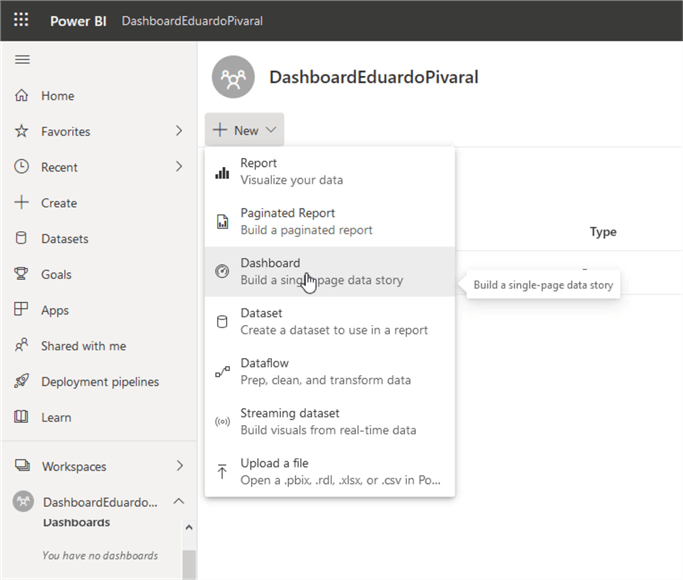
Put in a descriptive name and click on Create.
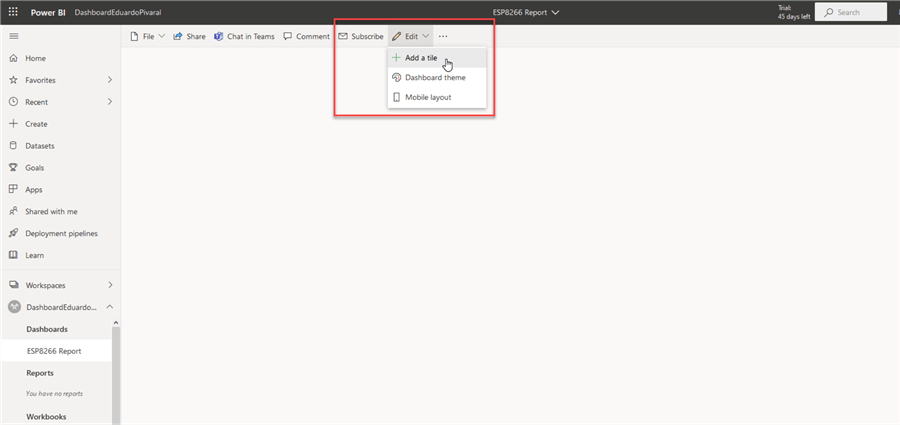
The new dashboard will open automatically, now we can create our first visualization, for this go to Edit > Add a tile.
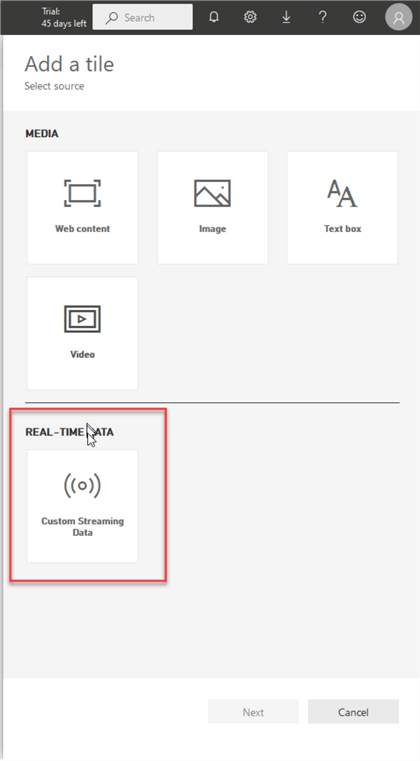
In the new window select Custom Streaming Data, and then click on Next:
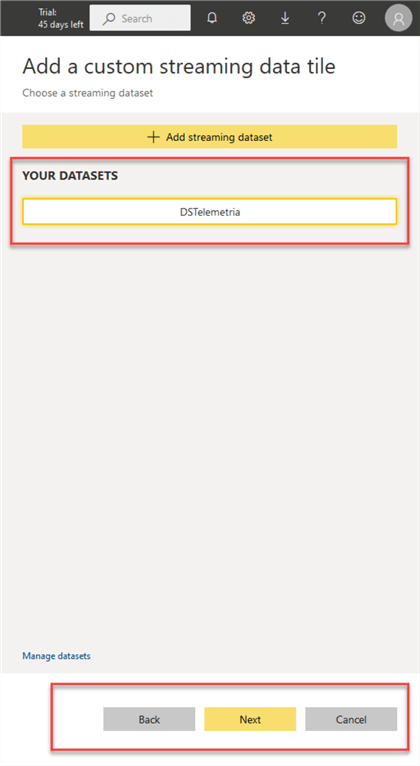
Select the dataset created by the Stream Analytics job, and click on Next:
For visualization type, select the one you want, for our example we will select Line Chart:
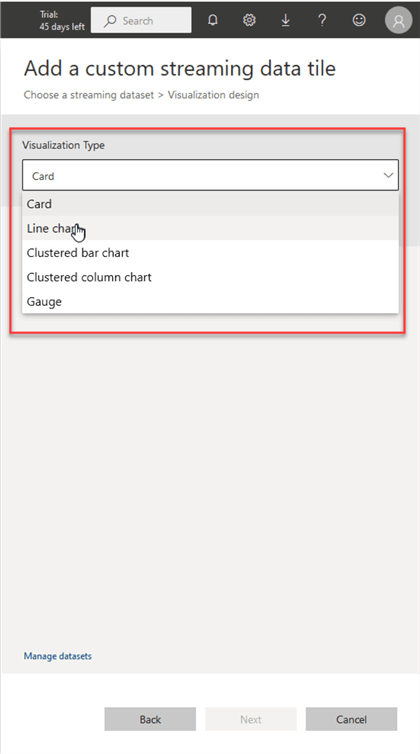
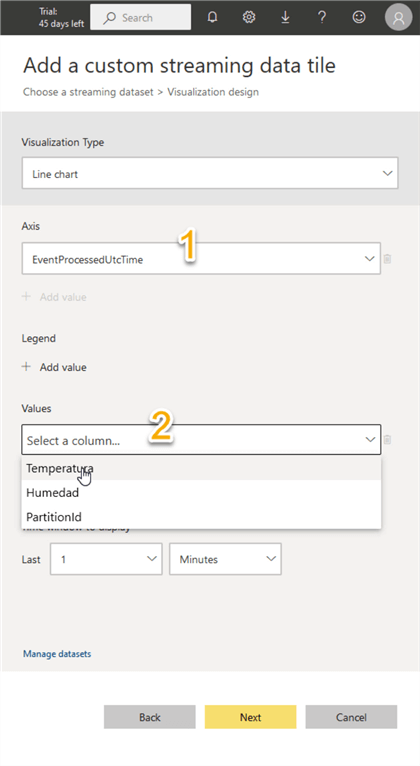
In the next screen select the following:
- The column you want in the X axis.
- The Value to plot (or the Y axis). Optionally you can put a field for the legend.
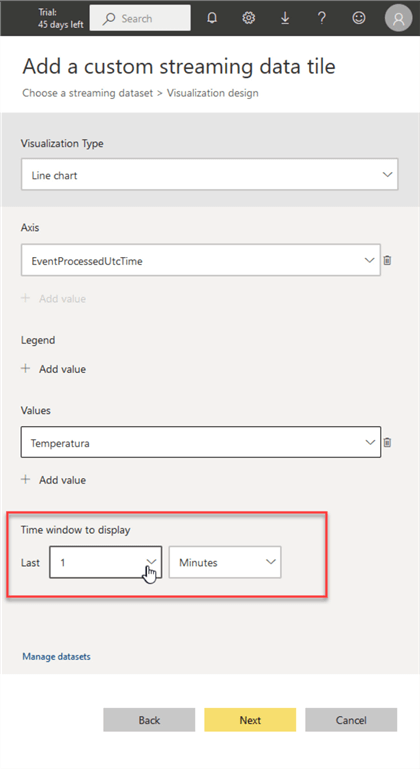
And then select the time window to display, this means the range of the data to visualize, the default is 1 minute:
As soon as you select valid values, you will see the data starts to display:
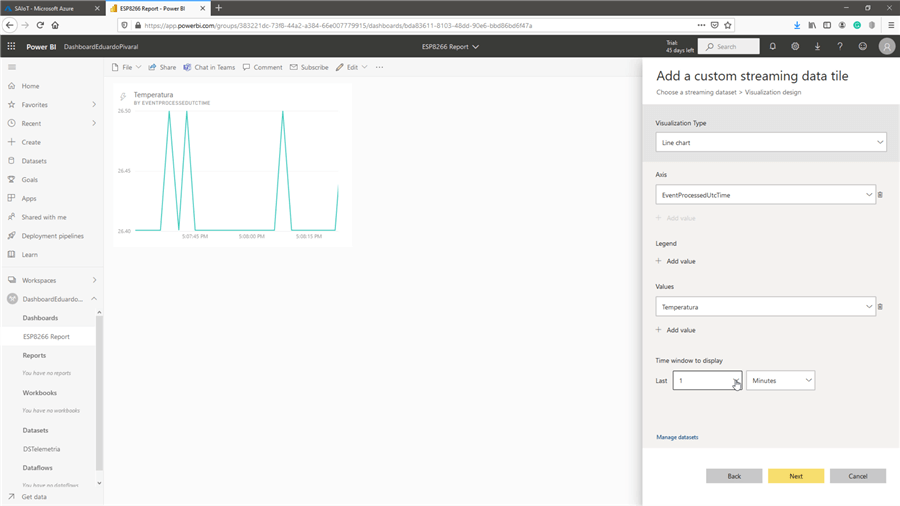
Once you are happy with the data to visualize, click on Next.
In the next window, you can optionally add a title and subtitle (in case you need multiple visualizations), and once you are done with your visualization, click on Apply to save it.
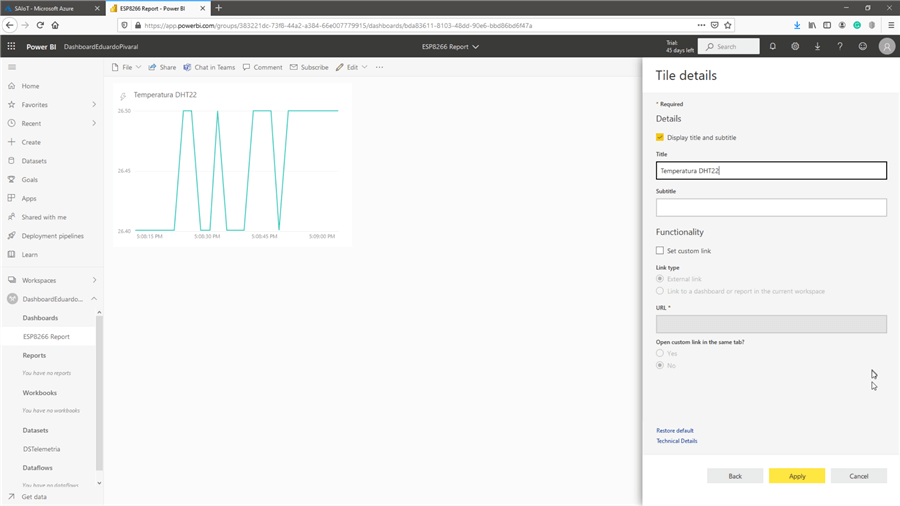
If you want to add another visualization, repeat the same process again:
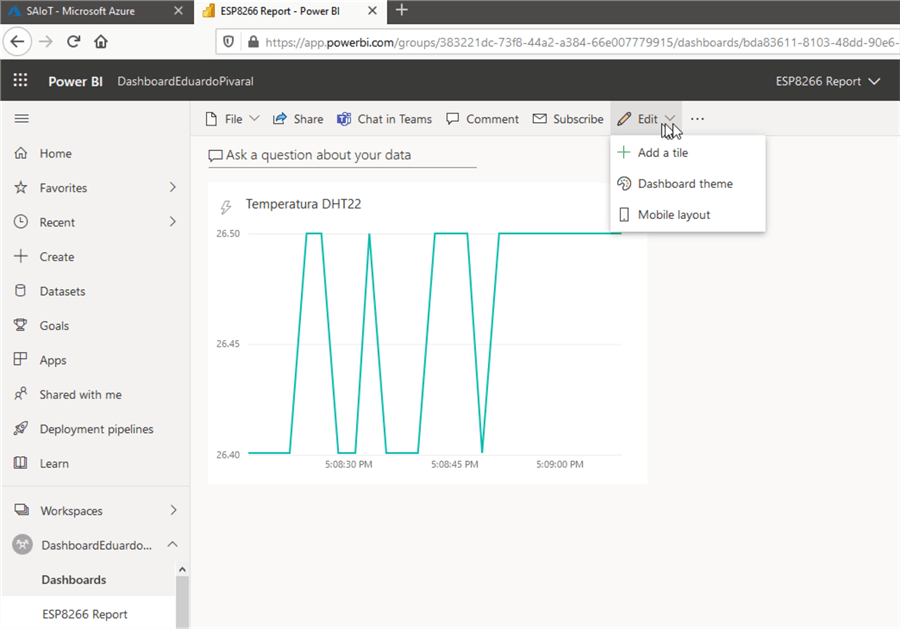
And at this point, you have a real time visualization, and as with other Power BI visualizations you can share it as you need:
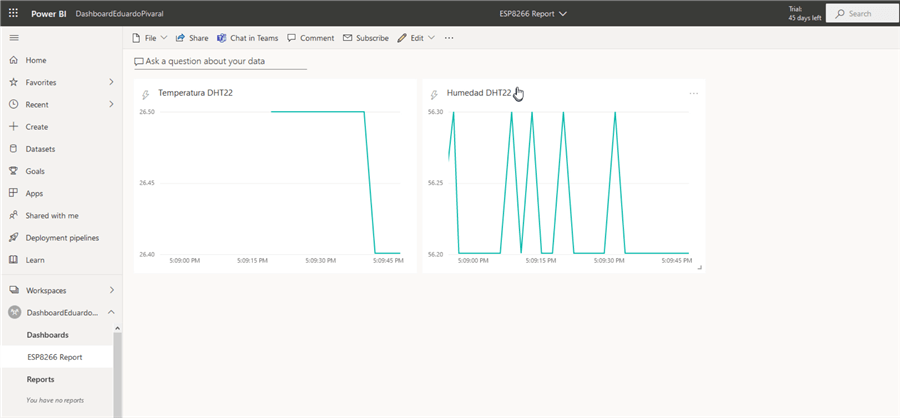
Also, if you need to do, you can adjust the visualizations to suit your needs, and you can move them:
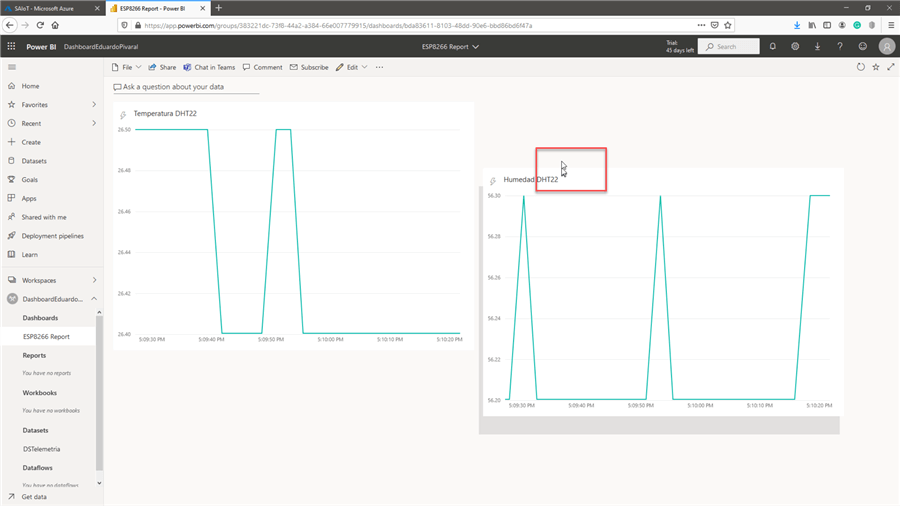
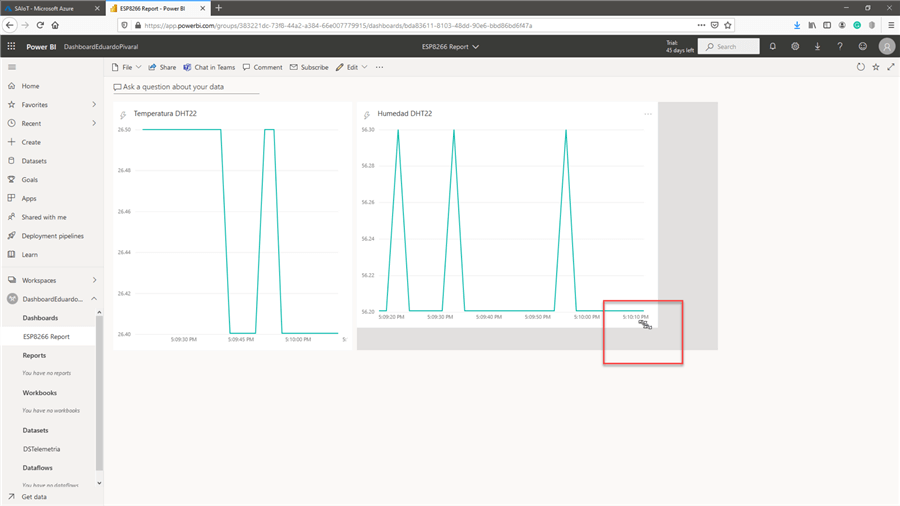
And resize them:
Next Steps
- If you want a guide to start using Power BI, you read these other tips: Part 1, Part 2 and Part 3.
- Want a getting started guide on IoT Hub and stream analytics jobs? Read this tip.
- Microsoft documentation for Stream Analytics jobs.
- Microsoft documentation for real time streaming.
Learn more about Power BI in this 3 hour training course.
About the author
 Eduardo Pivaral is an MCSA, SQL Server Database Administrator and Developer with over 15 years experience working in large environments.
 This author pledges the content of this article is based on professional experience and not AI generated.
View all my tips
Article Last Updated: 2021-08-26


