By: Koen Verbeeck | Updated: 2021-12-03 | Comments (1) | Related: > Functions System
Problem
In the T-SQL query language of SQL Server you can use different aggregate functions to perform calculations on numerical data. Those types of calculations are similar as those you would do in Excel. In this SQL Tutorial, we'll explain what aggregate functions are and how you can use them.
Solution
An aggregation function performs some calculation (like sum or average) on a set of values. It returns a single value. For example, when we selecting a couple of cells in Excel with numerical values, certain aggregations are calculated:
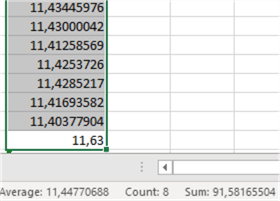
In this example, we selected 8 cells in the worksheet. We can see the count of the cells is 8, that the average value is around 11.48 and that the sum of all values is about 91.58. We can do the same calculations in SQL Server. Typically, you calculate on top of numerical values inside a column of a table (the count function is an exception since you can use it on any data type).
Aggregate Functions
Basic Calculations with SQL Aggregate Functions
Let's illustrate how we can calculate some aggregates in a SELECT statement. The queries are written using the Adventure Works sample SQL database. You can install it on your machine so you can execute the queries yourself to see the results.
The following query calculates the minimum value (i.e. SELECT MIN), the maximum value (i.e. SELECT MAX), the average (i.e. SELECT AVG) and the sum function for the sales amount column:
SELECT
     MinAmt   = MIN([SalesAmount])
    ,MaxAmt   = MAX([SalesAmount])
    ,AvgAmt   = AVG([SalesAmount])
    ,TotalAmt = SUM([SalesAmount])
FROM [AdventureWorksDW2017].[dbo].[FactInternetSales];
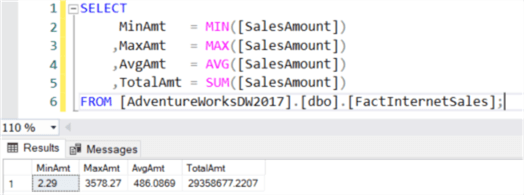
A single row is returned in the result set with a scalar result for each function. Aggregate functions like these require the column is numerical. If the column has another data type, an error is returned:
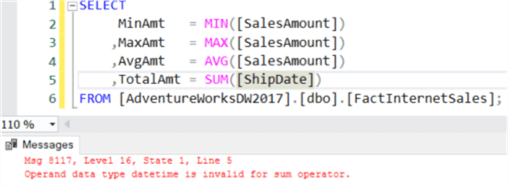
The count function doesn't have this limitation. You can use this function on columns with any data type (with the exception of image, ntext or text, which are all deprecated). The function counts the number of items in the column.
SELECT
     MinAmt   = MIN([SalesAmount])
    ,MaxAmt   = MAX([SalesAmount])
    ,AvgAmt   = AVG([SalesAmount])
    ,TotalAmt = SUM([SalesAmount])
    ,Cnt      = COUNT([ShipDate])
FROM [AdventureWorksDW2017].[dbo].[FactInternetSales];
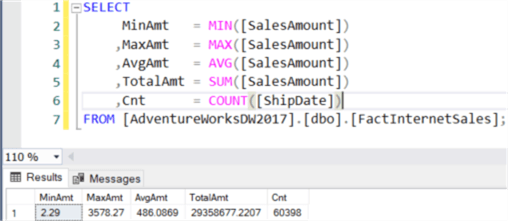
The difference between SUM and COUNT is that SELECT SUM adds all of the values inside the column together, while SELECT COUNT just counts the number of items in the column. The difference can be clearly seen with this sample query:
WITH cte_sampledata AS
(
    SELECT 1 AS mycolumn
    UNION ALL
    SELECT 2
    UNION ALL
    SELECT 3
    UNION ALL
    SELECT 4
    UNION ALL
    SELECT 5
)
SELECT SumColumn = SUM(mycolumn), CountColumn = COUNT(mycolumn)
FROM [cte_sampledata];

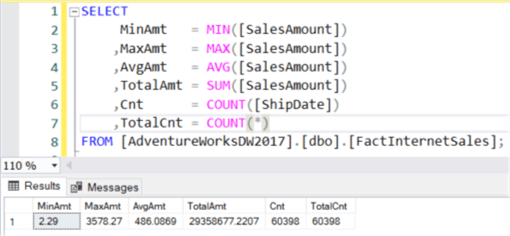
SUM and COUNT will only return the same result if the column contains only the values 1. With COUNT, you can also count the number of rows in the table instead of the number of items in a column. This can be done by using SELECT COUNT(*).
SELECT
     MinAmt   = MIN([SalesAmount])
    ,MaxAmt   = MAX([SalesAmount])
    ,AvgAmt   = AVG([SalesAmount])
    ,TotalAmt = SUM([SalesAmount])
    ,Cnt      = COUNT([ShipDate])
    ,TotalCnt = COUNT(*)
FROM [AdventureWorksDW2017].[dbo].[FactInternetSales];
NULL Values
Aggregate values ignore NULL values, with the exception of COUNT(*).
WITH cte_sampledata AS
(
    SELECT 1 AS mycolumn
    UNION ALL
    SELECT 2
    UNION ALL
    SELECT 3
    UNION ALL
    SELECT 4
    UNION ALL
    SELECT 5
    UNION ALL
    SELECT NULL
)
SELECT SumColumn = SUM(mycolumn), CountColumn = COUNT(mycolumn), TotalCount = COUNT(*)
FROM [cte_sampledata];

As you can see, the original count and sum remain the same, even though an extra record was added to the sample data. The COUNT(*) does count the row with the NULL value.
Expressions instead of Columns
You can also use expressions inside aggregate functions. The result of the expression has to be numeric, except for COUNT. For example, see this syntax:
SELECT TotalAmt = SUM([OrderQuantity] * [UnitPrice])
FROM [AdventureWorksDW2017].[dbo].[FactInternetSales];

Using DISTINCT
It's also possible to use distinct values inside an aggregation function. Let's add an extra row with the value 1 to our example:
WITH cte_sampledata AS
(
    SELECT 1 AS mycolumn
    UNION ALL
    SELECT 2
    UNION ALL
    SELECT 3
    UNION ALL
    SELECT 4
    UNION ALL
    SELECT 5
    UNION ALL
    SELECT NULL
    UNION ALL
    SELECT 1
)
SELECT SumColumn = SUM(mycolumn), CountColumn = COUNT(mycolumn), TotalCount = COUNT(*)
    ,SumDistinct = SUM(DISTINCT mycolumn), CntDistinct = COUNT(DISTINCT mycolumn)
FROM [cte_sampledata];

The results explained:
- SumColumn takes the sum of all values except NULL. 1 + 2 + 3 + 4 + 5 +1 = 16.
- CountColumn counts the non-null values of the column. This is the set {1,2,3,4,5,1} which has 6 members.
- TotalCount just counts the numbers of rows, which is 7.
- SumDistinct takes the sum of all the distinct values, again without NULL. 1 + 2 + 3 + 4 + 5 = 15.
- CntDistinct counts the non-null unique values of the column. This is the set {1,2,3,4,5}, which has 5 members.
Adding more Columns to the SELECT Clause
Up till now we only had aggregate functions in our SELECT clause. If you include other columns, you'll get the following error:

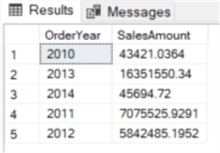
Once you start using aggregate functions, a column needs to be either inside an aggregate function, or a GROUP BY clause. This clause tells the database engine over which columns you want to calculate the aggregate function. Our example becomes:
SELECT OrderYear = YEAR(OrderDate), [SalesAmount] = SUM([SalesAmount])
FROM [AdventureWorksDW2017].[dbo].[FactInternetSales]
GROUP BY YEAR(OrderDate);
The query now has the following meaning: it will calculate the total sum of the sales amount for each year there were orders.
It's important to use the same expression in the GROUP BY clause as in the SELECT list. If we would have used just OrderDate, we would get the following result:
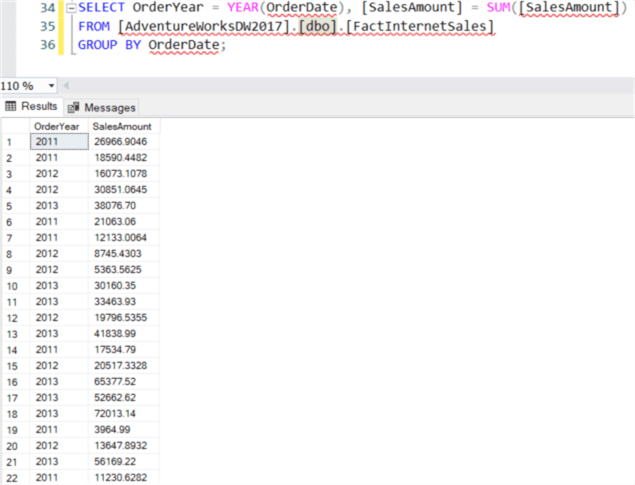
Here we have aggregated our sales amount per order date (not year), but we are displaying the year. This leads to confusing results.
Calculating Sub and Grand Totals
Suppose we have the following sample data:
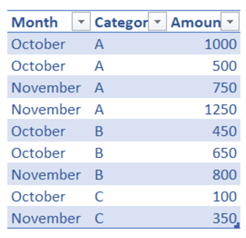
If we create a pivot table in Excel, we can see it automatically calculates sub and grand totals for us:
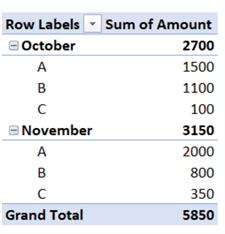
Can we do the same in T-SQL? Luckily we can, use the CUBE, ROLLUP or GROUPING SETS options. Let's illustrate using ROLLUP:
WITH SampleData AS
(
    SELECT [Month] = 'October' , Category = 'A', Amount = 1000 UNION ALL
    SELECT [Month] = 'October' , Category = 'A', Amount = 500  UNION ALL
    SELECT [Month] = 'November', Category = 'A', Amount = 750  UNION ALL
    SELECT [Month] = 'November', Category = 'A', Amount = 1250 UNION ALL
    SELECT [Month] = 'October' , Category = 'B', Amount = 450  UNION ALL
    SELECT [Month] = 'October' , Category = 'B', Amount = 650  UNION ALL
    SELECT [Month] = 'November', Category = 'B', Amount = 800  UNION ALL
    SELECT [Month] = 'October' , Category = 'C', Amount = 100  UNION ALL
    SELECT [Month] = 'November', Category = 'C', Amount = 350
)
SELECT
     [Month]
    ,Category
    ,Amount = SUM(Amount)
FROM [SampleData]
GROUP BY ROLLUP([Month],[Category]);
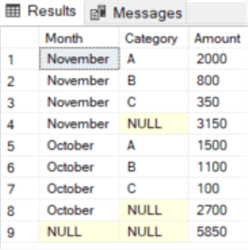
We can see the ROLLUP option added extra rows with some NULL values. On row 4, the month is November but the category is NULL. This means the row displays the subtotal for the month November. The same is true for row 8 for the month October. The last row displays the grand total, where both the month and the category are NULL.
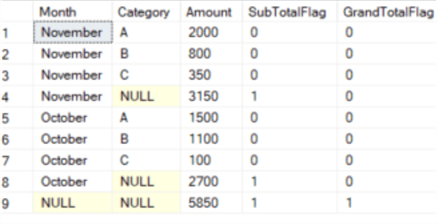
How can we easily distinguish which rows are subtotals or grand totals? What if the source data also contains NULL values? We can do this with the GROUPING function. This function returns 1 if a column is aggregated or 0 when it's not. We can only check for one column at a time though, so we need to include it twice in our query:
WITH SampleData AS
(
    SELECT [Month] = 'October' , Category = 'A', Amount = 1000 UNION ALL
    SELECT [Month] = 'October' , Category = 'A', Amount = 500  UNION ALL
    SELECT [Month] = 'November', Category = 'A', Amount = 750  UNION ALL
    SELECT [Month] = 'November', Category = 'A', Amount = 1250 UNION ALL
    SELECT [Month] = 'October' , Category = 'B', Amount = 450  UNION ALL
    SELECT [Month] = 'October' , Category = 'B', Amount = 650  UNION ALL
    SELECT [Month] = 'November', Category = 'B', Amount = 800  UNION ALL
    SELECT [Month] = 'October' , Category = 'C', Amount = 100  UNION ALL
    SELECT [Month] = 'November', Category = 'C', Amount = 350
)
SELECT
     [Month]
    ,Category
    ,Amount         = SUM(Amount)
    ,SubTotalFlag   = GROUPING([Category])
    ,GrandTotalFlag = GROUPING([Month])
FROM [SampleData]
GROUP BY ROLLUP([Month],[Category]);
The GROUPING_ID function can indicate the level of grouping for multiple columns at once.
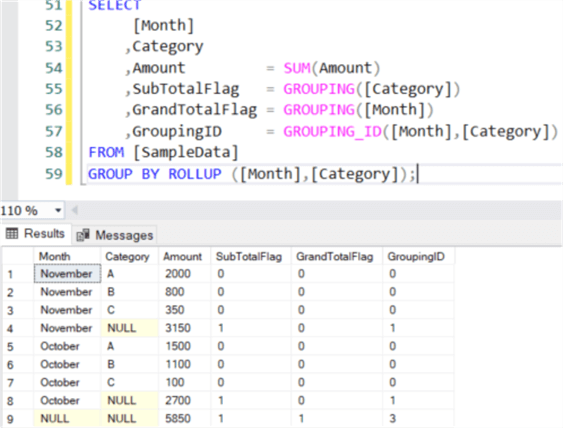
To make sense of the integer returned, you need to look at the two flags as binary input. When category is aggregated, you get 1, but the result of month is 0. The binary digit 01 corresponds with 1. When both category and month are aggregated, both flags are 1. The binary digit 11 corresponds with the number 3.
The functions CUBE and GROUPING_SETS give you more control over which subtotals are calculated, but they are out of scope for this SQL Tutorial. If you want to learn more about them, check out the following tips:
- Learning the SQL GROUP BY Clause
- Group By in SQL Server with CUBE, ROLLUP and GROUPING SETS Examples
Next Steps
- Try it out yourself! You can try the scripts from this tip on your own installation of the AdventureWorks database, or you can modify them for your data.
- There's a great tutorial about the SELECT statement.
- Window functions are not exactly the same as aggregate functions, but they are closely related. It uses the OVER clause to turn an aggregate function like SUM into an analytic function. You can learn more about this in the window functions tutorial.
About the author
 Koen Verbeeck is a seasoned business intelligence consultant at AE. He has over a decade of experience with the Microsoft Data Platform in numerous industries. He holds several certifications and is a prolific writer contributing content about SSIS, ADF, SSAS, SSRS, MDS, Power BI, Snowflake and Azure services. He has spoken at PASS, SQLBits, dataMinds Connect and delivers webinars on MSSQLTips.com. Koen has been awarded the Microsoft MVP data platform award for many years.
This author pledges the content of this article is based on professional experience and not AI generated.
View all my tips
Article Last Updated: 2021-12-03


