By: Scott Murray | Updated: 2022-04-13 | Comments | Related: > Power BI
Problem
What is Microsoft Power BI? When and why should it be used? Who should use Power BI? How does it help your daily workload?
Solution
The above questions are a great starting point for describing the 5 Ws of Power BI.
Within the Business Intelligence and Dashboard markets, Microsoft's investment in Power BI has resulted in its placement in the Leader category of Gartner's Magic Quadrant of Analytics and Business Intelligence platforms. However, even if a technology evaluator like Gartner notes Power BI's leadership, dashboard consumers, developers, and designers must also justify the positive benefits of using Power BI along with acknowledging where it could do better.
Within this tutorial, we will be using Power BI desktop for a limited number of examples. Thus, to get started Power BI Desktop must be downloaded from: Getting started with Power BI. Additionally, we will be using the WideWorldImportersDW database as a basis for our data sources; this database can be downloaded from GitHub. If you need a refresher on bringing data into Power BI please see: Querying SQL Server Data with Power BI Desktop.
What is Microsoft Power BI Desktop?
To get started with the questions, let us first answer what is Power BI (and what is it not). Power BI is a multiple user business intelligence and analytics platform. It encompasses several tools and services that all work together to allow for the design, development, and consumption of reports and dashboards. These are used to analyze and convey information then turn it into knowledge. There are many pieces that make up the platform; the most important aspects include:
- Applications
- Power BI Desktop
- Report Builder for Power BI
- Visual Studio to develop SSRS reports for Power BI
- Power BI App
- Web platforms
- Power BI Service
- Power BI Administration console
- Mobile version of Power BI Service
- Power BI for Report Server
- Power BI Analytics
- Data Source Connections
- Hundreds of on-premises connectors for databases, web, and file based objects
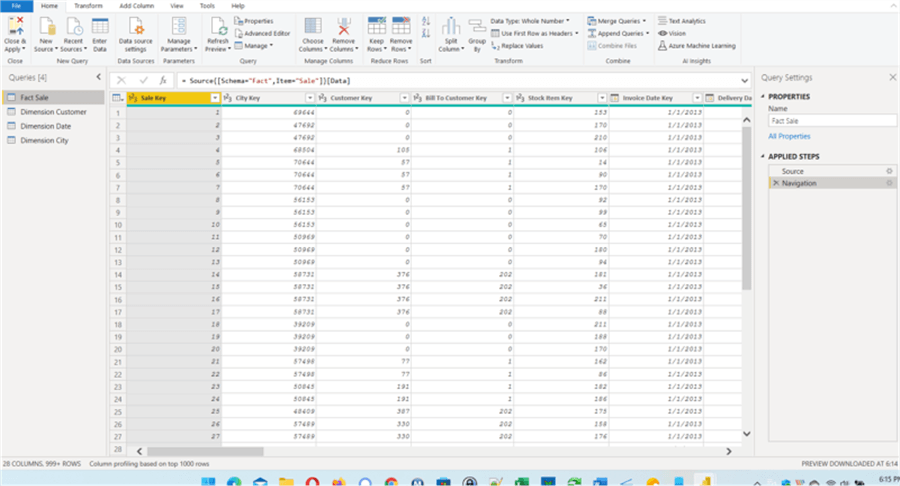
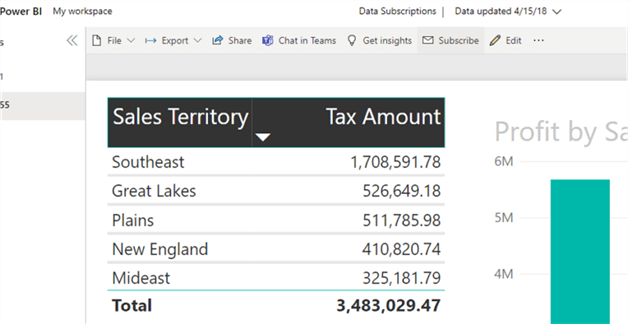
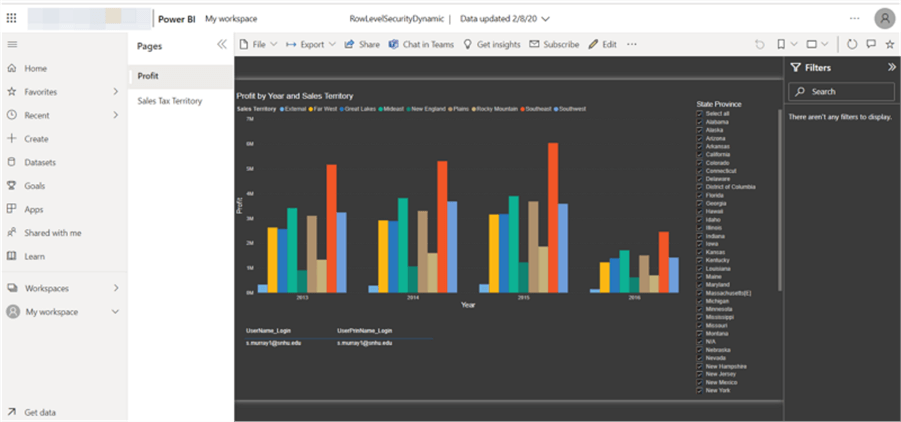
Based on the above list, it can easily be seen that Power BI is a multi-faceted solution that encompasses everything from development tools all the way to consumer reporting and dashboard solutions. In between those two boundaries are items such as data modeling capabilities in Power BI Desktop and exporting and notifications in the Power BI web service.
Up to this point we have discussed what Power BI is and does, but there are also a few items that it is not. Power BI is not:
- Full scale ETL tool with scheduling and orchestration
- Webserver outside of the Power BI Service
- Database query tool (although it can be used for data exploration)
- Programming language (you do use SQL, M, and DAX within Power BI)
- OLAP design tool
Even with these limitations, Power BI offers the ability to significantly transform, join, merge, and store data to be presented in a dashboard format.
Why Microsoft Power BI for data visualizations?
Of course, even knowing what Power BI is, there needs to be justification on why Power BI should be the tool to use when facing a business intelligence, data visualization or data analytics project. First and foremost, Power BI is one of the leading dashboard / business intelligence tools on the market. However, there are many factors that make it the right and correct tool for a report / dashboard / data analysis development shop to decide to use it for their main development tool for dashboard and reports.
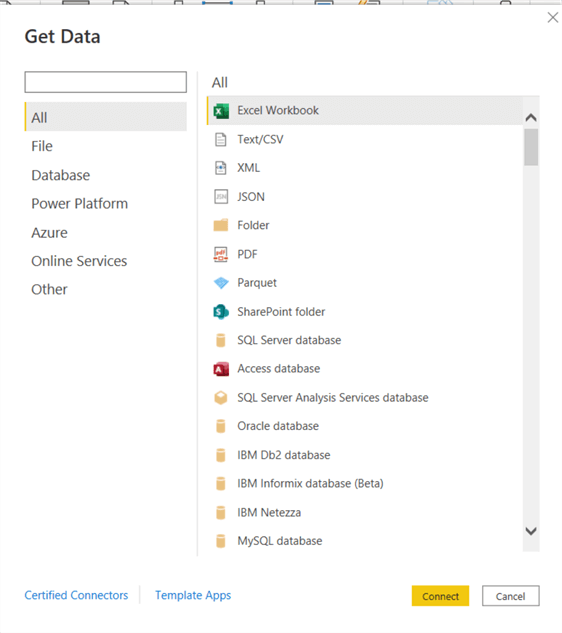
In my mind one of the leading factors stems from the number and variety of available sources that can be used as the basis for the data sets in the Power BI. Currently there are several hundred available sources that are available including well know items such as SQL Server, Teradata, and Snowflake. However, several non-traditional sources are also accessible to be used. Those traditional sources are just the beginning with options to access various Azure spaces, Google Analytics, QuickBooks, website and web tables, and Salesforce. This list is rounded out with file-based data sets such as JSON files, CSV files and Parquet files.
The second reason to use Power BI reports stems from its rich set of predefined visualizations that are complemented and enhanced by large number of community developed visuals available in the App Store. Some of the visuals have been certified by Microsoft, while others have not. Be sure to take into account the certification of any Power BI visual that is available in the App Store before adding that visual to Power BI.
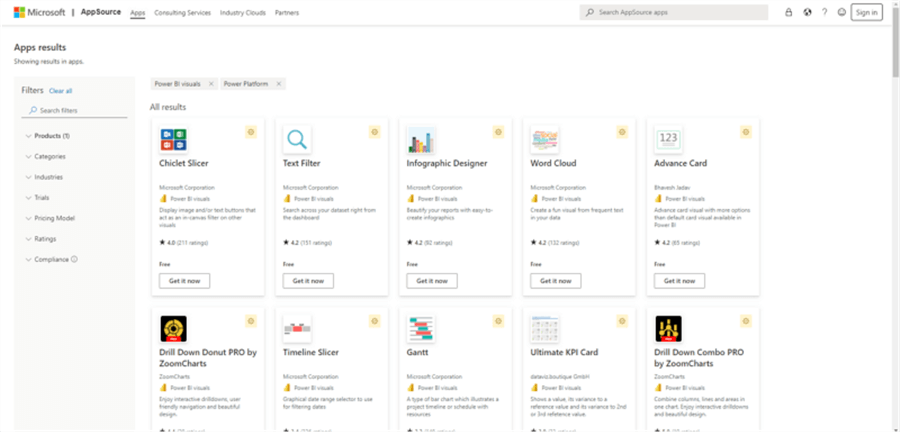
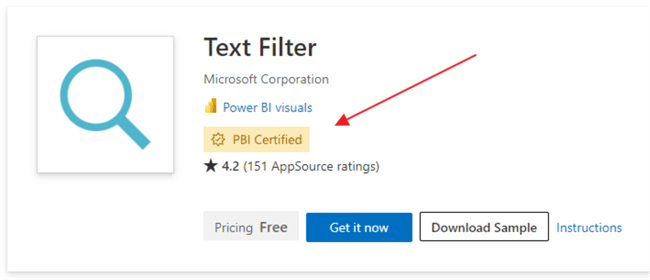
The third main reason why Power BI is a great tool to use for reporting and dashboard development stems from its ease of user, self-service type of setup. Power BI Desktop is free to download (for Windows) and, then, it is easy seek out data sources which are ultimately used to load data. Of course, the development process can get complicated very quickly with many data sources that are joined together and through the usage of DAX and M. Nevertheless, Power BI has the ability to make data exploration easy and driven by self-service report designers and users.
The final main reason for using Power BI is the ability to merge, join, and append data sets into a single source or even a single dashboard report. The merge functionality means that business logic can be pushed in some cases to a Power BI model which allows joining / merging via strict or fuzzy logic.
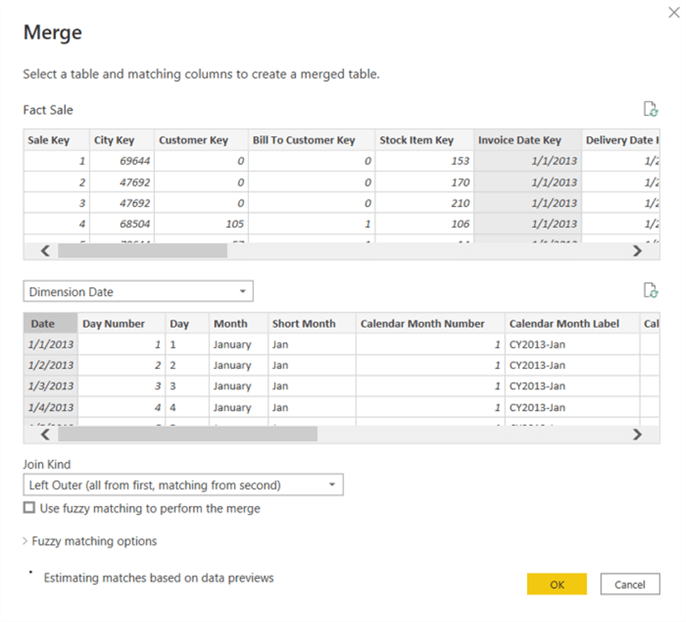
Likewise, there are a few reasons why you may not want to use Power BI. First, if an on-premises client-based solution is desired or required, Power BI is not the best option. Additionally, although Power BI has significant and extremely useful transformation capabilities, it is not a replacement for mainline ETL/ELT and orchestration tools such as SSIS, dbt, or Apache Airflow.
When use Power BI?
Based on the why of Power BI, we can push into defining the when to use Power BI and when not to use Power Bl. Power BI is available for use and should be used on just about any Business Intelligence dashboard project. Additionally, Power BI Desktop is an excellent data exploration tool that is also free to use! However, once a Power BI file is published to the web, licenses will need to be purchased in order to serve up any dashboards or reports. The costs start at just under $10 per user per month for such a Pro license while a Premium license starts at $20 per user per month or $4,995 per organization capacity per month.
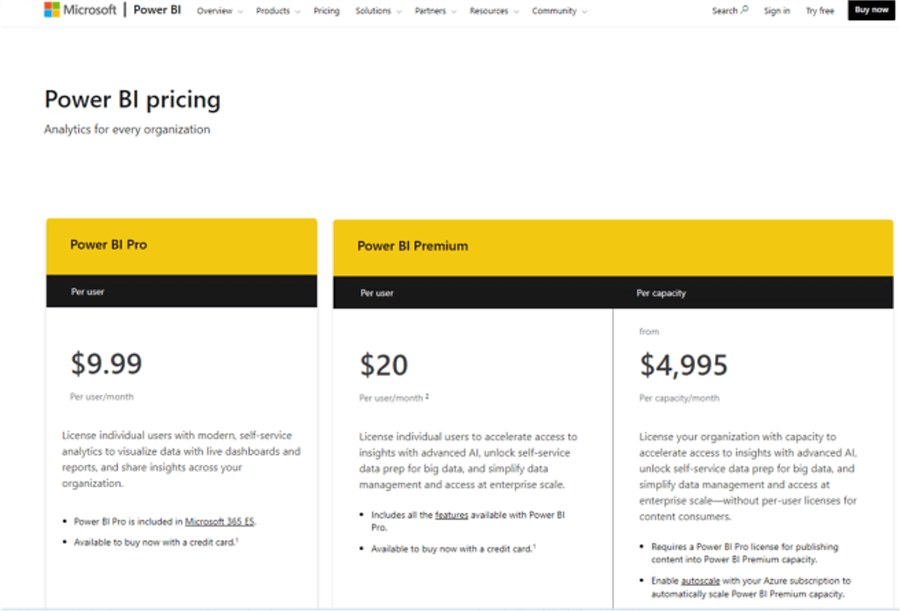
As can be seen, the different tiers of licensing costs open up a discussion on when it is best to move to the Power BI web service. In most cases the ability to provide dashboards online with ease is extremely helpful to achieve and worth the costs paid. It is easy to start with a Per User license to test out Power BI capabilities, but as your dashboard infrastructure grows, moving to the Premium Capacity tier can be worthwhile and relevant.
Thus, Power BI can be used anytime a basic or complex dashboard reporting solution is needed.
Who uses Power BI?
Power BI Desktop is available for anyone to download and start to explore the design capabilities of Power BI. On its own, Power BI Desktop and Report Builder for Power BI are exceptional data exploration tools, so anyone wanting to connect to one of the hundreds of sundry data sources should take advantage of these features in Power BI Desktop and to a less extent Report Builder for Power BI. These individuals could include:
- Business Analysts
- Data Analyst
- Report and Dashboard Developers
- ETL/ELT Developers
- Financial Analysts
- Business Intelligence Engineers
- Data Engineers
- Data Architects
- Statisticians
- Data Scientists
As you can see from this list, Power BI Desktop and Report Builder can be used by just about anyone dealing with data. You will note that the data load process goes from simple, single data sets to multiple data sets numbering in the hundreds to data sets that are used as the basis for machine learning purposes. These usages show why spectrum of designers and developers spans so many different titles.
As we move to the Power BI service the group of users expand to a wider group of users. In addition to those listed above, you also now include any end consumer of a dashboard or report. This group certainly includes folks such as:
- Accountants
- Financial Analysts and Staff
- Operations Analysts and Staff
- Various End Customers
- Clinical Analysts and Staff
Certainly, the list goes on and on as the usage is as varied as the industries and organizations that can use Power BI.
Where to use Power BI?
In a roundabout way, the answer to where Power BI is used is actually everywhere. Power BI has made inroads into many companies big and small. Industry usage includes finance, medical and hospitals, education, manufacturing, construction among many other areas. Additionally, Power BI is used throughout the world, although a heavy presence does exist in the United States. Gartner also indicates that Power BI, Tableau, and Qlik along with Looker (Google), MicroStrategy, and Domo dominate the Business Intelligence and Analytics software group --2021 Gartner Magic Quadrant for Analytics and Business Intelligence Platforms. As such, Power BI is used wherever folks want to use a robust, easy to use analytics tool.
How to use Power BI?
Now that we have set up the bulk of positives about using Power BI, it is now time to discuss how to go about using the tool. As outlined in the introduction, the first step is to download and install Power BI Desktop. Next data needs to be loaded into Power BI via the Get Data or Transform Data options.

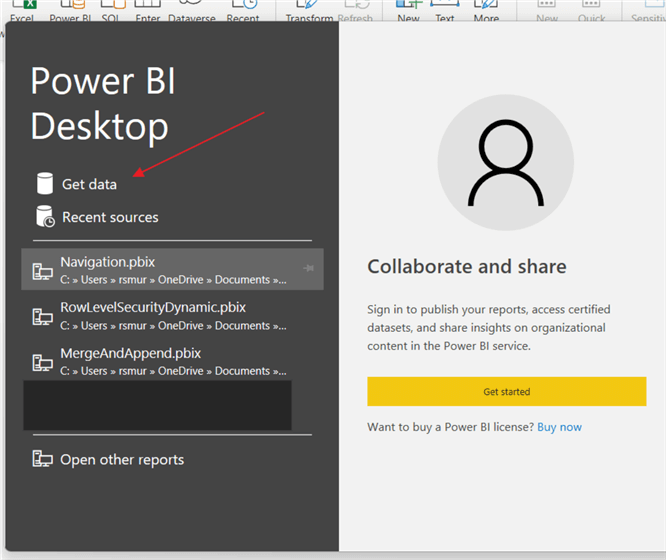
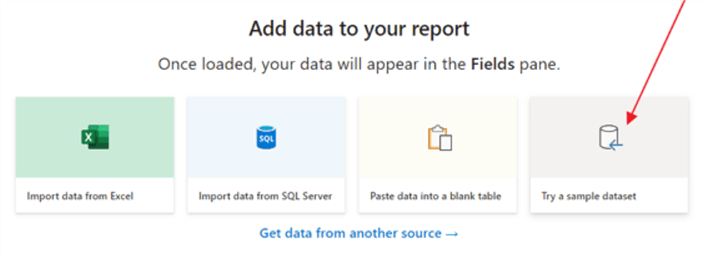
You can certainly use the Wide World Importers SQL Server database mentioned in the introduction as a basis. Likewise, to get started even faster, opening a new report, and selecting Try a sample dataset can be selected.
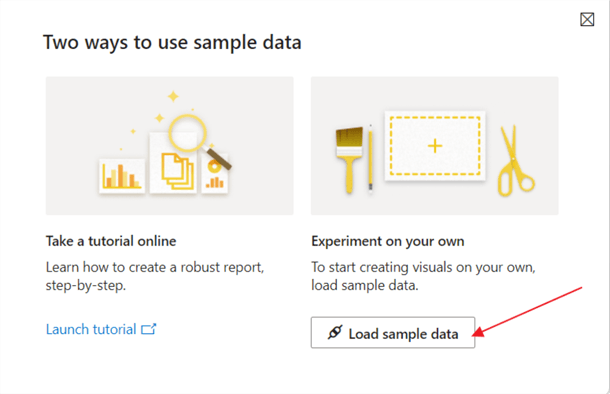
Next selecting the Load sample data option loads sample financial data.
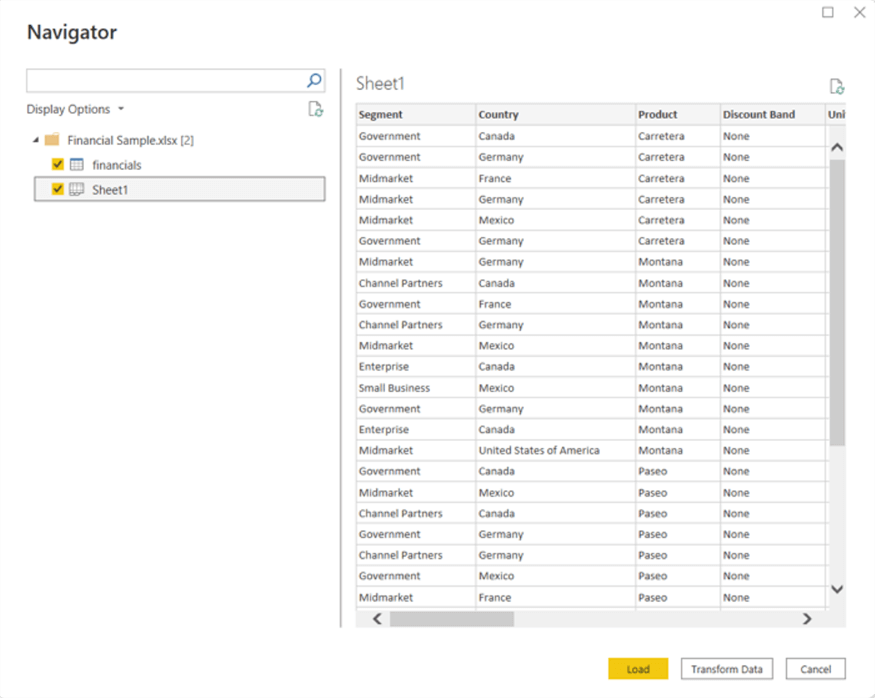
Finally, selecting the financial samples tables loads the financial and segment data into Power BI.
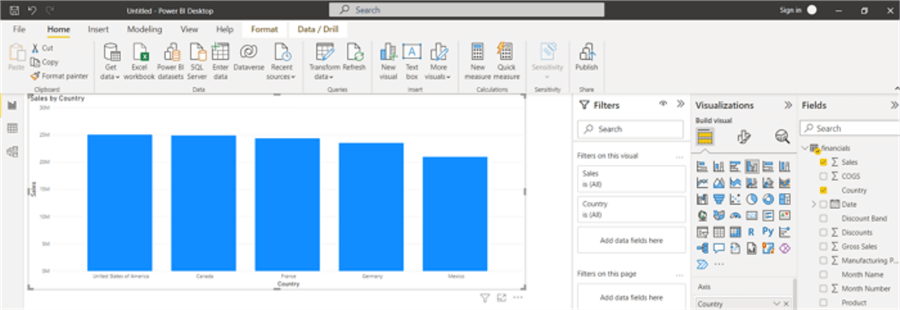
After loading the data, we are ready to start creating our first dashboard as shown below. On MSSQLTips there are many tips which outline how to design various reports. I would recommend taking a look at these tips to help get you started with designing your Power BI dashboards:
- Power BI Data Source (PBIDS) Files
- Power BI Datasets
- Power BI Desktop Data Source Considerations
- Getting started with DAX in Power BI
- Power BI Templates, Printing and Favorites
- Read and Import Data from PDF Files using Power BI
- Power BI Best Practices
- Power BI Data Import and Export with Excel
- Design Patterns for Calculated Tables in Power BI
Summary
Throughout this tip the 5 Ws (Who, What, Where, When, Why) plus How of Power BI were covered. Power BI is a rich and compelling business intelligence tool which is used by dashboard designers and end report consumers alike. Power BI Desktop, one component of the Power BI Suite, allows for the exploration of data and more importantly the design and development of reports and dashboards which can be published to the Power BI service for end report consumers.
Next Steps
Learn more about Power BI in this 3 hour training course.
About the author
 Scott Murray has a passion for crafting BI Solutions with SharePoint, SSAS, OLAP and SSRS.
This author pledges the content of this article is based on professional experience and not AI generated.
View all my tips
Article Last Updated: 2022-04-13


