By: Rick Dobson | Updated: 2022-09-08 | Comments | Related: > TSQL
Problem
I am a SQL professional who was recently assigned to help support a team that focuses on building data science models for financial securities. Please provide a walkthrough of typical steps for building time series models with SQL for financial time series data. Demonstrate the application of the general steps in a specific example. The team I recently joined often uses MACD indicators, so coverage of that topic would also be helpful.
Solution
Many different data science models predict when to buy and sell financial securities. Often, these models are based on stock price patterns and/or security price indicators. Examples of stock price indicators previously covered in MSSQLTips.com for model building include MACD, RSI, or moving average crossover indicators.
Instead of focusing on a particular type of indicator, this article presents a framework for data science time series model building that may be appropriate, with some adaptation, to many types of indicators. The code used in this article utilizes SQL. While SQL has no specialized features for model building, it may often be the case that basic time series data are stored in SQL Server (or another SQL database engine). When this is the case, time series models can be represented in the tables processed by SQL code. When this is not the case, it is often easy to migrate data from another source to a SQL database engine. You can find examples of implementing the migrations in these references:
- Overview of How to Collect Securities Prices for SQL Server
- Collecting Time Series Data for Stock Market with SQL Server
- Techniques for Collecting Stock Data with Python
It is common to express a time series model where a value or an action for the current period relies on an outcome in a prior period. For example, this tip considers models for trading securities where buying a security in the current period is indicated by a signal to buy a security in a prior period. The security can be held until the model discovers a sell signal that indicates the desirability to sell a security to retain accumulated gains or minimize any further losses. The number of periods between buying and selling a security can vary from one buy-sell cycle to the next and across securities. The role of the time series model is to find when to buy and sell a security so that the model user can accumulate wealth over a succession of buy-sell cycles.
Key Steps in the Modeling Framework
The key steps for evaluating a model with the framework from this tip can be easy to identify and perform with SQL. This tip includes SQL code examples for all the key steps for building a time series model.
- Start by migrating the historical time series price values for a security to a database table.
- Compute price indicators based on the historical time series price values.
- Compute the model logic for the computed price indicators and/or historical price values.
- Evaluate the performance of a model for accumulating wealth across successive
trades for:
- Multiple sets of time periods
- Multiple ticker symbols
This tip focuses on the first three steps. These are the steps for building a model. The computational process for price indicators will vary depending on the indicator your model relies on. The SQL code for the time series model depends on the model logic for mapping price indicator values to buys and sells for a security.
- You should design your model code to readily accommodate different ticker symbols in successive runs.
- You should also design your model code to easily process data for different historical data sets.
The process walkthroughs in this tip provide enough context on the model building framework to apply to any time series data you prefer to use instead of just the data from this tip. The examples in this tip sacrifice performance and generality to emphasize clarity and ease of use for applying the framework.
A subsequent tip will highlight key issues with the fourth step for evaluating time series models over multiple ticker symbols and time periods.
Migrating Historical Time Series Price Values for a Security to a Database Table
The model for this tip depends on the open and close prices for a ticker symbol on daily trading days. Relationships between MACD indicator and signal indicator values determine when to buy and sell a security, and these indicator values are based on daily close prices. The relationships between indicators can specify the dates for buy signals and sell signals for a buy-sell cycle. The model also needs daily open prices because the model buys a security on the day after a buy signal and sells on the day after a sell signal. Therefore, the first step is to obtain historical open and close prices for a ticker symbol across the trading dates for which a model is being trained or tested.
Here is a T-SQL script for gathering the open and close prices required by a time series model for securities trading.
- The code below extracts data from the source_prices table in the dbo schema
of the DataScience database.
- This table was originally created and populated in a tip titled Migrating Time Series Data to SQL Server from Yahoo Finance and Stooq.com. The source_prices table in the current tip is merely a copy of the table named yahoo_finance_ohlcv_values_with_symbol from the prior tip.
- The source_prices table has data ticker symbols for 62 ticker symbols.
- The following script uses the @symbol local variable to reference the AAPL
ticker symbol. This symbol is for Apple, Inc.
- The columns extracted from the source_prices table include the date, symbol, open, and close.
- The data in these columns are for open and close prices for the @symbol value across a set of dates from January 1, 2011, through December 31, 2021. These starting and ending dates designate the range of dates over which MACD indicator values and signal indicator values are computed.
- Several other columns populate the results set from the select statement
in the following script.
- The ewma_12 and ewma_26 columns eventually get populated with exponential moving average values for close prices ending on successive trading dates. The script excerpt below does not compute the exponential moving averages. Instead, the following script assigns arbitrary place markers in a temp table (#temp_for_ewma) that are updated in subsequent code. If you would like a refresher on temp tables, check these references.
- The row_number column contains successive integer values designating sequential rows in the #temp_for_ewma order temp table. A row_number column is often of value for time series data when the time series values do not occur on successive calendar dates. For example, stock markets typically close on weekends and about ten observed holidays. The row_number column serves as a unique row identifier for each row of time series data in a way that calendar dates are not. When your code needs to reference the order of time series values with gaps between calendar dates, a row_number column can be helpful.
use DataScience
go

-- use this segment of the script to set up for calculating
-- ewma_12 and ewma_26 for ticker symbol

-- initially populate #temp_for_ewma for ewma calculations
-- @ewma_first is the seed

declare @symbol varchar(5) = 'AAPL'
declare @ewma_first money =
(select top 1 [close]
   from dbo.source_prices
   where symbol = @symbol order by [date])

-- create and populate base table for ewma calculations (#temp_for_ewma)

drop table if exists #temp_for_ewma

-- ewma seed run
select
 [date]
,[symbol]
,[open]
,[close]
,row_number() OVER (ORDER BY [Date]) [row_number]
,@ewma_first ewma_12
,@ewma_first ewma_26
into #temp_for_ewma
from dbo.source_prices
where symbol = @symbol
and [date] >= 'January 1, 2011'
and [date] <= 'December 31, 2021'
order by row_number

-- optionally echo of results set for
   select * from #temp_for_ewma order by row_number
Here are two excerpts from the #temp_for_ewma table.
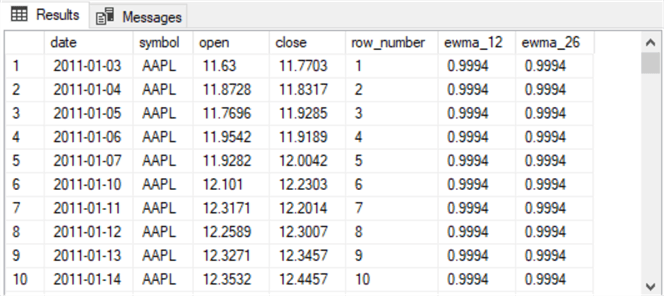
- The top pane below is an image of the top ten rows from the #temp_for_ewma table.
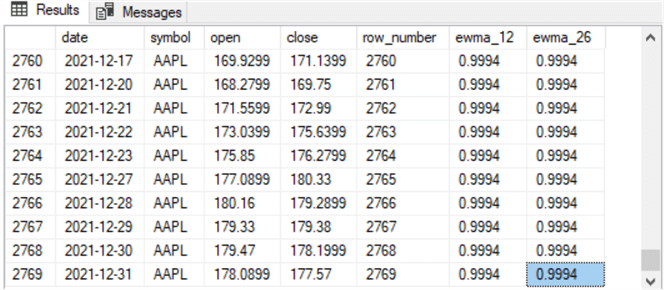
- The bottom pane below is an image of the bottom ten rows from the #temp_for_ewma table.
- Selected observations about the excerpts are that
- There are 2769 rows in the table (see the row_number value in the last row of the bottom pane below).
- January 1 and 2, as well as January 8 and 9 for 2011, are missing in the results set because these days are weekend days.
- All the ewma_12 column values and ewma_26 column values are identical. These place marker values are updated in the next script example.
- The open and close column values represent open and close prices for the date column value on a row. Open and close prices are represented by numeric values with up to four places after the decimal point.
- All the rows have the same symbol column value (AAPL). This is the same value assigned to the @symbol local variable in the preceding script. If you update the value of the @symbol local variable, then the symbol column value in the results set from the preceding script will also change (provided the alternative symbol is available in the source_prices table).
Computing ewma_12 and ewma_26 for MACD Indicator Values
The next step toward computing MACD indicator values for the model evaluation is to transform the ewma_12 and ewma_26 place marker values from the #temp_for_ewma table to computed values. The ewma_12 column is for exponential moving averages with a period length of 12, and the ewma_26 column is for exponential moving averages with a period length of 26. The key point of this script is that it shows how to use an update statement inside a while loop to replace the ewma_12 and ewma_26 place marker values with computed values. A while loop is preferred to calculate exponential moving averages with SQL. The code is listed below for your easy reference. You can find a more detailed discussion of the computational process for generating the transformed values in the "The T-SQL for the first part" subsection of this prior tip.
Here is the code for generating the transformed ewma_12 and ewma_26 column values from place marker values to computed values.
-- Transform ewma_12 and ewma_26 column values

-- NULL ewma values for first period
update #temp_for_ewma
set
    ewma_12 = NULL
   ,ewma_26 = NULL
where row_number = 1

-- optionally echo #temp_for_ewma before updates in while loop
-- select * from #temp_for_ewma order by row_number

-- calculate ewma_12 and ewma_26
-- @ew_12 is the exponential weight for 12-period
-- @ew_26 is the exponential weight for 26-period
-- start calculations with the 3rd period value
-- seed in the second row is the close price
-- from the 1st period; it is used as ewma for 2nd period
declare @max_row_number int = (select max(row_number) from #temp_for_ewma)
declare @current_row_number int = 3
declare @ew_12 real = 2.0/(12.0 + 1), @today_ewma_12 real
declare @ew_26 real = 2.0/(26.0 + 1), @today_ewma_26 real

while @current_row_number <= @max_row_number
begin

   set @today_ewma_12 =
   (
   -- compute ewma_12 for period @current_row_number
   select
   top 1
   ([close] * @ew_12) + (lag(ewma_12,1) over (order by [date]) * (1 - @ew_12)) ewma_12_today

   from #temp_for_ewma
   where row_number >=  @current_row_number -1 and row_number <=  @current_row_number
   order by row_number desc
   )

   set @today_ewma_26 =
   (
   -- compute ewma_26 for period 3
   select
   top 1
   ([close] * @ew_26) + (lag(ewma_26,1) over (order by [date]) * (1 - @ew_26)) ewma_26_today

   from #temp_for_ewma
   where row_number >=  @current_row_number - 1 and row_number <=  @current_row_number
   order by row_number desc
   )

   update #temp_for_ewma
   set
       ewma_12 = @today_ewma_12
      ,ewma_26 = @today_ewma_26
   where row_number =  @current_row_number

   set @current_row_number =  @current_row_number + 1

end

-- optionally echo of results set for
   select * from #temp_for_ewma order by row_number
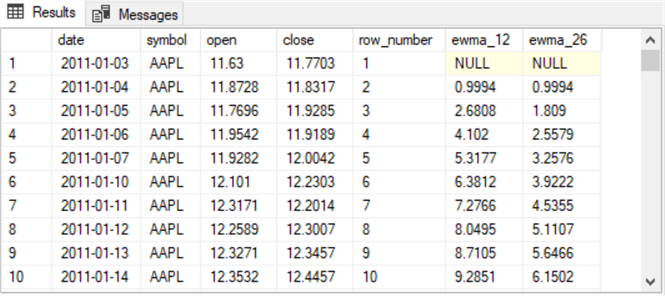
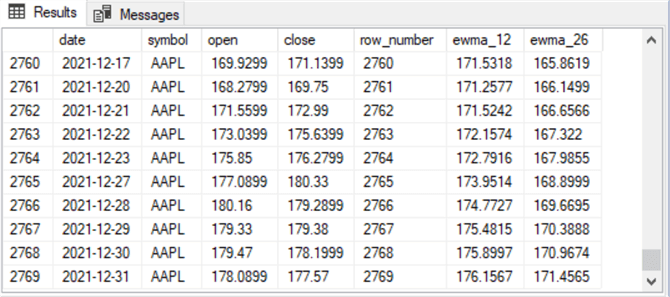
Here are two excerpts from the #temp_for_ewma table after the transformation performed by the preceding code segment. The top screenshot is for the first ten rows with transformed ewma_12 and ewma_26 column values, and the bottom screenshot is for the last ten rows in the #temp_for_ewma table. These screenshots below correspond to the screenshots at the end of the preceding section. They have identical values, except for the ewma_12 and ewma_26 columns.
Computing the MACD Indicator Values
There are three types of MACD indicators.
- The MACD indicator is typically computed as ewma_12 less ewma_26.
- Another type of MACD indicator is the signal indicator. The signal
indicator is typically computed as the 9-period exponential moving average of
the MACD indicator.
- Rising underlying closing prices are often, but not always, associated with trading dates when the MACD indicator exceeds the signal indicator.
- Conversely, falling underlying closing prices are often, but not always, associated with trading dates during which the signal indicator exceeds the MACD indicator.
- The third type of MACD indicator is called the MACD histogram indicator. The MACD histogram indicator is computed as the MACD indicator less signal indicator. This indicator is named a histogram indicator because its values are frequently displayed as histogram bars around the MACD centerline value (0).
- The settings of 12, 26, and 9 are commonly, but not always, used in MACD indicator applications. This tip applies the commonly used values of 12, 26, and 9. Some thoughts about alternative settings can be found here.
- The model in this tip relies on the MACD and signal line indicators.
Different analysts use MACD indicators in different ways.
- For example, the meaning of MACD indicators is frequently interpreted from charts with MACD indicator values and signal indicator values appearing in a chart window below the closing prices or candlestick bars in another chart window above the one showing the MACD indicators.
- This tip relies on quantitative comparisons evaluated with SQL code of the MACD indicator values versus the signal indicator values.
- This section presents code that shows how to compute the three MACD indicators. The following section shows how to use these indicator values to suggest when to buy and sell financial securities.
Here is the code for computing the MACD, signal, and histogram indicators for the AAPL ticker symbol. Recall that this ticker was used when pulling historical time series in the "Migrating historical time series price values for a security to a database table" section. A full explanation of this code is available from this prior tip.
The listing is provided here for your easy reference. The following code segment is part of a listing that depends on the scripts from prior sections.
-- add and populate column of macd indicator values to #temp_for_ewma
alter table #temp_for_ewma add macd float
go

-- update the macd column from a subquery with the macd expression
update #temp_for_ewma
   set #temp_for_ewma.macd = macd_values.macd
from
(select date, (ewma_12 - ewma_26) macd  from #temp_for_ewma) macd_values
where #temp_for_ewma.date = macd_values.date

-- add and populate column of signal values to #temp_for_ewma
alter table #temp_for_ewma add signal float
go

--initialize first two rows of signal column
update #temp_for_ewma
   set #temp_for_ewma.signal = null
where #temp_for_ewma.row_number <= 2

-- initialize third row of signal column
update #temp_for_ewma
   set #temp_for_ewma.signal = (select macd from #temp_for_ewma where row_number = 2)
where row_number = 3

-- populate rows 4 through @max_row_number for signal column
-- based on 9-period exponential moving average of macd
declare @current_row_number int
set @current_row_number = 4
declare @max_row_number int = (select max(row_number) from #temp_for_ewma)
declare @alpha_9 float = 2.0/10.0

while @current_row_number <= @max_row_number
begin

   --select @current_row_number
   update #temp_for_ewma
      set signal = @alpha_9 * (select macd from #temp_for_ewma where row_number = @current_row_number)
         + (1 - @alpha_9) * (select macd from #temp_for_ewma where row_number = @current_row_number - 1)
   where row_number = @current_row_number

   set @current_row_number = @current_row_number + 1
end

-- add and populate column of macd_histogram values
alter table #temp_for_ewma add [macd_histogram] float
go

-- update the macd_histogram column from a subquery with the macd_histogram expression
update #temp_for_ewma
   set #temp_for_ewma.[macd_histogram] = macd_histogram_values.macd_histogram
from
(select date, (macd - signal) macd_histogram  from #temp_for_ewma) macd_histogram_values
where #temp_for_ewma.date = macd_histogram_values.date

-- optionally display results set for #temp_for_ewma
-- after adding and populating columns for macd, signal, and macd_histogram
   select * from #temp_for_ewma order by row_number
Here are two excerpts from the results set for the preceding script. These two excerpts correspond to those at the ends of the "Migrating historical time series price values for a security to a database table" and "Computing ewma_12 and ewma_26 for MACD indicator values" sections. All three pairs of excerpts present values from the first ten trading days and the last ten trading days. Each section adds a new set of columns to the results in the #temp_for_ewma table.
The excerpts below show all the columns needed (and more) for building a model based on MACD indicators. As indicated above, the model in this tip uses just the columns for the MACD and signal indicators. The following section shows how to create one last set of columns that allow the prediction of buy dates and sell dates based on the mapping of the indicators to model logic for determining when to buy and sell a security.


Mapping MACD Indicators to Buy and Sell Actions for a Security
Until this point in this tip, the focus has been on generating the MACD indicators for a set of source data along with open and close prices for each trading day for a symbol. This section of the tip pivots to mapping MACD indicator values and signal indicator values to buy, hold, or sell actions for each trading day. In the context of this tip, a hold action is just the action for a trading day between the buy action and sell action within a buy-sell cycle. These three actions (buy, hold, and sell) adequately describe simple trading models. These simple trading models do not account for short selling or options trading for financial securities.
The same MACD indicators can be processed in various ways to specify buy, hold, or sell actions. In fact, this prior tip uses different model logic than that used in the current tip for mapping the MACD indicator and the signal indicator to buy actions and sell actions. A subsequent tip will drill down on quantitative comparisons of outcomes associated with the model from this tip versus the model from the prior tip. The main purpose of this tip is to present this second MACD model in a way that empowers SQL professionals and data science engineers to implement whatever model logic seems most promising to them.
Because MACD and signal indicator values are computed from close prices, you cannot compute them until after the close of trading on a trading day. Therefore, the earliest date for which a MACD indicator can designate an action is the next trading date (presuming you are not doing day trading). MACD indicators can generate signals based on the close price from the current trading date for actions to take on the opening of the next trading date.
- A trading date with a MACD indicator value pointing to a buy action or a sell action on the next row is called, respectively, either a buy signal row or a sell signal row.
- A trading date after a signal row is called either a buy action row or a sell action row.
One additional thought worth mentioning is that buy and sell signals can depend on MACD indicator values from trading dates preceding the current trading date. This is particularly useful when you want to make a signal dependent, in part, on a change in a MACD indicator value from a preceding trading date to the current trading date. This kind of logic is common in many time series models. The code in this tip uses the SQL Server lag function to look back one trading date. This function is convenient because it allows values from preceding trading dates to appear on the row for values in the current trading date.
Code for Indicating the Beginning and End of a Buy-Sell Cycle
The code for indicating the beginning and end of buy-sell cycles depends on three new columns added to the results set excerpted at the end of the preceding section. A buy-sell cycle is from the date for a buy action through the date for a sell action. The buy signal that occurs before a buy action is not technically a part of a buy-sell cycle because the buy signal occurs on the trading date before a buy action. Nevertheless, the buy signal date is an interesting date for buy-sell cycles.
The model in this tip is built around two ideas: buy just after the MACD indicator rises from below to above the signal indicator and when the MACD indicator is concurrently below its centerline value so that the momentum (as assessed by the MACD indicator) has not already reached a level well towards the end of a buy-sell cycle. These ideas can be denoted with three column values.
- The macd<0 column value marks a row in a column where the MACD indicator
is below its centerline value (0).
- This column has a value of 1 when the MACD indicator is less than 0
- In contrast, the column has a value of 0 when the MACD indicator is not less than 0
- The macd>signal column value marks a row in a column where the MACD indicator
is greater than the signal indicator
- This column has a value of 1 when the MACD indicator is greater than the signal indicator
- Else, the column has a value of 0
- The 0 for macd>signal_lag_1 column value reflects the value of the MACD
indicator in the current period relative to the signal indicator in the preceding
period
- This column has a value of 0 when the MACD indicator is not greater than the signal indicator in the preceding period
- Else, the column has a value of 1
The following script populates the preceding three columns and describes how to use the column values to make buy action and sell action decisions.
- The first select statement populates the macd<0 and macd>signal columns; the source for this select statement is the #temp_for_ewma table and the destination for its results set is the #for_for_second_macd_trade_model table
- The second select statement populates the 0 for macd>signal_lag_1 column
- The source for this select statement is the #for_for_second_macd_trade_model table and the destination of its results set is the #for_second_macd_trade_model table
- Because the source for the second select statement is the output from the first select statement, the output from the second select statement contains values for all three columns (macd<0, macd>signal, and 0 for macd>signal_lag_1)
A criterion in the first select statement specifies when to start designating buy-sell cycles. This criterion is specified in the where clause of the first select statement. The criterion specifies that the select statement only returns buy-sell cycles starting on or after January 1, 2019. This criterion limits the size of the results set from the query. You can manipulate the criterion specification to another date to get more, less, or just different buy-sell cycles in the results set from the query. Alternatively, you can comment out this WHERE clause criterion to return buy-sell cycles based on all the rows from the #temp_for_ewma table.
-- add two new columns ([1 for macd>signal], [macd<0])for the macd trade model
-- and drop the macd_histogram column from the #temp_for_ewma table
-- save the results in the #for_for_second_macd_trade_model table
-- trade model data are set to start optionally in 'January 1, 2019'

declare @current_buy_date date, @current_buy_price money,
      @current_sell_date date, @current_sell_price money

drop table if exists #for_for_second_macd_trade_model

select
 date
,symbol
,[open]
,[close]
,row_number
,ewma_12
,ewma_26
,macd
,signal
,
 case
   when macd > signal then 1
   else 0
 end [1 for macd>signal]
,
 case
   when macd < 0 then 1
   else 0
 end [macd<0]

into #for_for_second_macd_trade_model
from #temp_for_ewma
where [date] >= 'January 1, 2019'
order by date

-- optionally echo #for_for_macd_trade_model
-- select * from #for_for_second_macd_trade_model order by date

-- add [0 for macd>signal_lag_1] columns to
-- #for_for_second_macd_trade_model columns in a new table
-- named #for_second_macd_trade_model

drop table if exists #for_second_macd_trade_model

select
 *
,
 case
    when lag([1 for macd>signal],1) over (order by row_number) = 0 then 0
   else 1
 end [0 for macd>signal_lag_1]
into #for_second_macd_trade_model
from #for_for_second_macd_trade_model

-- optionally echo #for_for_macd_trade_model
   select * from #for_second_macd_trade_model
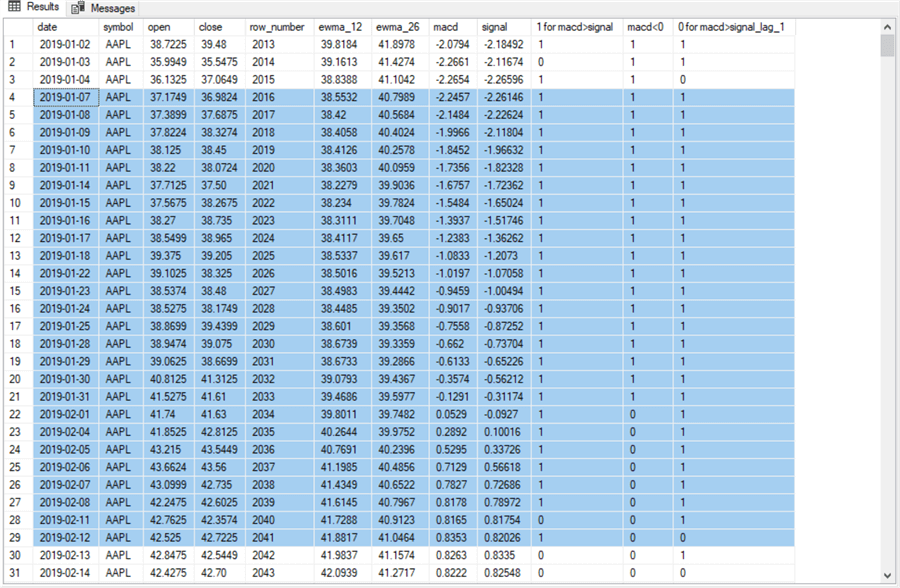
Here is an excerpt from the preceding script that shows the beginning and end of a winning trade.
- The shaded rows are from 2019-01-07 through 2019-02-12.
- The first shaded row denotes a buy action.
- The buy action row always starts a buy-sell cycle.
- The row immediately before a buy action row is a buy signal row.
- The buy signal row has a 1 in the macd>signal column and its macd<0 column. Additionally, the buy signal row has a value of 0 in its 0 for macd>signal_lag_1 column.
- When the buy signal matches these criteria, the model logic designates that the next row must be a buy action row. The values in the buy action row do not affect whether a buy occurs on that row, but the column values can affect the status of the next row.
- The last row in the shaded area denotes a sell action row.
- The sell action row always ends a buy-sell cycle.
- The row immediately before the sell action row is a sell signal row.
- The sell signal row must always have a value of 0 in its macd>signal column and the preceding row in that column must have a value of 1. This configuration of column values indicates that the macd>signal column value flips from 1 to 0 on the sell signal row. This flip causes the sell signal row to point to a sell action on the next row.
- The first shaded row denotes a buy action.
If you examine the open column value on the buy action row and compare it to the open column value on the sell action row, you can see that this trade generated a profit of $5.3501 (42.525 – 37.1749) per share. The model can issue suboptimal buy signals and sell signals. In these cases, the model generates a loss instead of a profit per share in a buy-sell cycle.
A follow-up tip to the current tip will examine the performance of the model described in this tip and compare the performance of the model in this tip to the model in another previously presented tip for predicting buy actions and sell actions based on MACD indicators.
Code to Display Buy Signal, Buy Action, and Sell Signal
Columns like 1 for macd>signal, macd< 0, 0 for macd>signal_lag_1 can be critical for mapping MACD indicator values to a table. The values in these columns are inputs for model-based decisions about when to buy and sell a security. However, they may be unnecessarily complicated for someone who just wants to know when the model says it is the date to buy or sell a security.
Consequently, it may be helpful for some model users to have access to columns that indicate when to buy and sell a security without any references to expressions based on MACD indicators. The following script displays buy signal rows, in addition to buy action and sell action rows. The buy signal row is critical because it points to the beginning of each buy-sell cycle. As indicated previously, the buy action and sell action rows designate the start and end of each buy-sell cycle.
Here is the code for populating buy signal, buy action, and sell action columns. It is a little lengthy but not very difficult to understand for a motivated reader. The following bullets list the key steps in the code.
- The code starts by populating a buy signal column in the #for_second_macd_trade_model_with_buy_signal table based on the #for_second_macd_trade_model source table.
- Next, the code populates the buy action column in the #for_second_macd_trade_model_with_buy_action table.
- Finally, the code populates the sell action column in the #for_second_macd_trade_model_with_sell_action table.
-- compute buy_signal column values and save in
-- #for_second_macd_trade_model_with_buy_signal

drop table if exists #for_second_macd_trade_model_with_buy_signal

select #for_second_macd_trade_model.*, for_buy_signal_column.buy_signal
into #for_second_macd_trade_model_with_buy_signal
from #for_second_macd_trade_model
join
(
-- compute buy_signal column values as derived table
select
 date
,
 case
   when [1 for macd>signal]=1
       and [macd<0]=1
       and [0 for macd>signal_lag_1] = 0 then 1
   else 0
 end buy_signal
from #for_second_macd_trade_model
) for_buy_signal_column
on #for_second_macd_trade_model.date = for_buy_signal_column.date

-- optionally echo #for_second_macd_trade_model_with_buy_signal
-- select * from #for_second_macd_trade_model_with_buy_signal order by date

-- compute buy_action column values and save in #for_second_macd_trade_model_with_buy_action

drop table if exists #for_second_macd_trade_model_with_buy_action

--select #for_second_macd_trade_model_with_buy_signal.*, for_buy_action_date_values.date , for_buy_action_date_values.buy_action
select #for_second_macd_trade_model_with_buy_signal.*,for_buy_action_date_values.buy_action
into #for_second_macd_trade_model_with_buy_action
from #for_second_macd_trade_model_with_buy_signal
join
(
-- compute buy_action_date values
select
 date
,buy_signal
,
 case
  when lag(buy_signal,1) over (order by date) = 1 then 1
  else 0
 end buy_action
,lead(date,1) over (order by date) buy_action_date
from #for_second_macd_trade_model_with_buy_signal
) for_buy_action_date_values
on #for_second_macd_trade_model_with_buy_signal.date = for_buy_action_date_values.date


-- optionally echo #for_second_macd_trade_model_with_buy_action
-- select * from #for_second_macd_trade_model_with_buy_action

-- develop code for sell_action column values
-- start with buy_action dates, which are ultimately
-- the antecedents of sell_action column values

-- populate #buy_action_dates with
-- successive buy action dates
drop table if exists #buy_action_dates


-- dates for buy actions
select row_number() over (order by date) [id#], date buy_action_date
into #buy_action_dates
from #for_second_macd_trade_model_with_buy_action
where buy_action = 1

-- optionally echo #buy_action_dates
-- select * from #buy_action_dates


declare
   @cnt_of_buy_action_dates int = (select count(*) from #buy_action_dates),
   @idx_for_buy_action_dates int = 1

-- populate #sell_action_dates

drop table if exists #sell_action_dates

create table #sell_action_dates(
 id# int
,sell_action_date date)


-- loop that returns sell_action dates matching preceding
-- buy_action dates
while @idx_for_buy_action_dates <= @cnt_of_buy_action_dates
begin

-- criteria are [0 for macd>signal_lag_1] = 0
-- and select date from #buy_action_dates where [id#] = @idx_of_buy_action_dates
-- top 1 and order by clause ensures the retrieval of the most recent date following
-- a [0 for macd>0_lag_1] = 0 date row following one of the buy_action date rows
insert #sell_action_dates
select top 1 @idx_for_buy_action_dates [id#], date sell_action_date
from #for_second_macd_trade_model_with_buy_action
where [0 for macd>signal_lag_1] = 0
      and date > (select buy_action_date from #buy_action_dates where [id#] = @idx_for_buy_action_dates)
order by date

-- increment the @idx_for_buy_action_dates by 1 to point at
-- the next buy_action row until there are no remaining buy_action rows
set @idx_for_buy_action_dates = @idx_for_buy_action_dates + 1

end


-- optionally echo #for_second_macd_trade_model_with_buy_action
-- select * from #sell_action_dates


-- compute buy_action column values and save in #for_second_macd_trade_model_with_sell_action
drop table if exists #for_second_macd_trade_model_with_sell_action
select
 #for_second_macd_trade_model_with_buy_action.*
,
 case
  when sell_action_date is null then 0
  else 1
 end sell_action
into #for_second_macd_trade_model_with_sell_action
from #for_second_macd_trade_model_with_buy_action
left join #sell_action_dates
on #for_second_macd_trade_model_with_buy_action.date = #sell_action_dates.sell_action_date

-- optionally echo #for_second_macd_trade_model_with_sell_action
   select * from #for_second_macd_trade_model_with_sell_action order by date
Perhaps the best way to illustrate the operation of the preceding code excerpt is with a few examples.
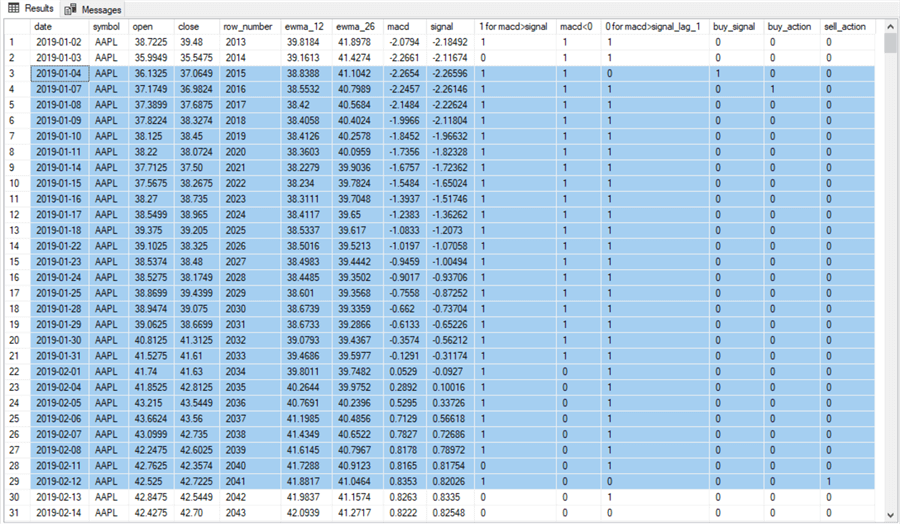
The rows from the #for_second_macd_trade_model_with_sell_action table for the first buy-sell cycle plus its preceding buy signal row are shaded in the screenshot below.
- The initial key columns of special interest are macd and signal, followed by 1 for macd>signal, macd<0, and 0 for macd>signal_lag_1.
- The last three columns are named buy_signal, buy_action, and sell_action. These are new columns added by the preceding code segment.
- The first shaded row starts with a buy signal on 2019-01-04 for the trading
days associated with the first buy-sell cycle from 2019-01-07 through 2019-02-12.
- The buy signal on 2019-01-04 has these column values from the model
logic
- 1 for the 1 for macd>signal column
- 1 for the macd>0 column
- 0 for the 0 for macd>signal_lag_1 column
- The buy-sell cycle ends with a sell action on 2019-02-12
- This trading date has a value of 0 for the 0 for macd>signal_lag_1 column
- The value for this column is derived from the 0 value for the 1 for macd>signal column for the sell signal row on 2019-02-11
- This is a winning trade because the open column value of 37.1749 for the buy action row on 2019-01-07 is less than the open column value of 42.525 for sell action row on 2019-02-12. The trade sold its AAPL shares for more than it bought them.
- The buy signal on 2019-01-04 has these column values from the model
logic
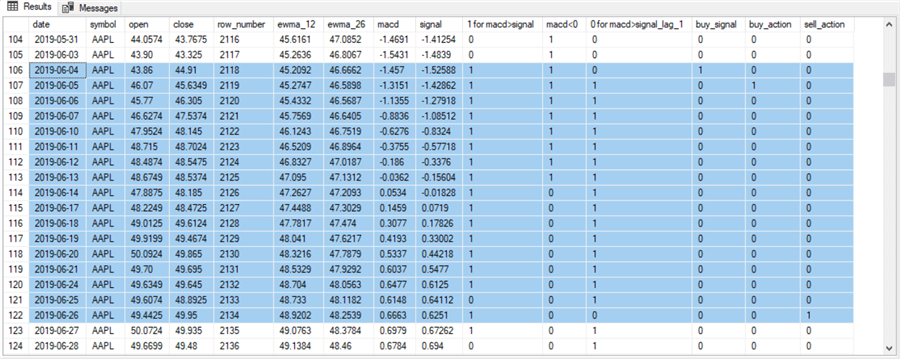
The second buy-sell cycle rows with its preceding buy signal row are highlighted in the following screenshot.
- The buy signal row on 2019-06-04, just before the start of the second buy-sell
cycle, has a buy_signal column value of 1. The model column values are
- 1 for 1 for macd>signal
- 1 for macd>0
- 0 for 0 for macd>signal_lag_1
- The sell action row on 2019-06-26 has a 1 in its sell_action column.
- This trading date has a value of 0 for the 0 for macd>signal_lag_1 column
- The value for this column is derived from the 0 value for the 1 for macd>signal column for the sell signal row on 2019-06-25
- This is another winning trade because the open value on the buy action row (46.07) is less than the open value on the sell action row (49.4425).
The third set of buy-sell rows with its preceding buy signal row are highlighted in the following screenshot.
- The buy signal row occurs on 2020-03-02. Notice the value of 1 in
the buy_signal column on this row. The model column values for this buy
signal row are again
- 1 for 1 for macd>signal
- 1 for macd>0
- 0 for macd
- The buy action row occurs on 2020-03-03. This is confirmed by the value of 1 in the buy_action column.
- The sell action row occurs on 2020-03-04. This is confirmed by the value of 1 in the sell_action column. Like the sell action row in the previous two examples, the 0 for macd>signal_lag_1 column has a value of 0.
- This third buy-sell cycle is for a losing trade because the open value for the buy action row (75.9175) is greater than the open value of the sell action row (74.11).

Across all three examples, the bookend values for the 0 for macd>signal_lag_1 are 0. The buy signal row for all examples is 0 for the buy signal row and 0 for the sell action row.
Next Steps
The download for this tip contains the completed T-SQL script for a model in one integrated SQL file. The edition of the script in the download lets you run the whole script. You can also edit the script to run it one step at a time, as described and illustrated in the text and screenshots within this tip. The download also includes a CSV file with the source_prices table values for the AAPL ticker symbol. You will need to migrate these comma-separated values to the source_prices table before running the script in whole or in part.
It may also be worth reminding you that the source data for 12 additional ticker symbols are available from the download for a prior tip. You can use the source data from these additional ticker symbols to test the model presented in this tip with fresh data. You can also use this additional data for designing and testing your custom models.
About the author
 Rick Dobson is an author and an individual trader. He is also a SQL Server professional with decades of T-SQL experience that includes authoring books, running a national seminar practice, working for businesses on finance and healthcare development projects, and serving as a regular contributor to MSSQLTips.com. He has been growing his Python skills for more than the past half decade -- especially for data visualization and ETL tasks with JSON and CSV files. His most recent professional passions include financial time series data and analyses, AI models, and statistics. He believes the proper application of these skills can help traders and investors to make more profitable decisions.
This author pledges the content of this article is based on professional experience and not AI generated.
View all my tips
Article Last Updated: 2022-09-08


