By: Aseel Al-Laham | Updated: 2023-06-16 | Comments (1) | Related: > Power BI
Problem
As a BI developer or data analyst who frequently works with Power BI or SSAS Tabular model, you may often receive requests to rank data in a table based on a specific expression. DAX RANKX function enables us to do so. This function allows you to evaluate an expression for each row in the table argument and then rank the rows based on the result. However, a few brainteaser behaviors associated with the function can catch users off guard.
In this tip, we'll explore two behaviors for RANKX that can lead to incorrect results and discuss workarounds and fixes, which are:
- RANKX issue with decimal values.
- Tabular model column sort and its effect on RANKX.
Solution
Before we dive into DAX RANKX behaviors, it's important to understand this function's basics. And if you are new to Data Analysis Expressions (DAX), check out these links to get started:
DAX RANKX Function
RANKX is a DAX statistical function that returns the rank of an expression evaluated in the current context. With RANKX, you can quickly and easily identify the top-performing values in your data set.
This DAX function is used to sort data in a specific order based on specific criteria.
The syntax for the RANKX function is straightforward, as seen below. According to Microsoft documentation, it takes five parameters, three of which are optional.
| Parameters | Necessity | Description |
|---|---|---|
| Table | Required | Any DAX expression that results in a table being returned over which the expression is evaluated. |
| Expression | Required | A DAX expression that produces a single scalar value that will be evaluated for every row in the table to create a range of all potential values for ranking. |
| Value | Optional | A DAX expression that produces a single scalar value whose rank is to be determined accordingly. If the Value parameter is not specified, then the expression parameter value at the current row will be utilized. |
| Order | Optional |
Its value determines the ranking order, either
in ascending or descending manner.
|
| Ties | Optional | Its value specifies the method for determining rank in case of a tie. Skip: In the case of a tie, the subsequent rank value is calculated by adding the rank value of the tie with the number of values that are tied. Dense: The next immediate rank value after a tie. This is the default value when the Ties parameter is not specified. |
And it returns "The rank number of value among all possible values of expression evaluated for all rows of table numbers," according to Microsoft documentation.
= RANKX ( <Table>, <Expression> [, <Value>] [, <Order>] [, <Ties>] )
RANKX Issue with Decimal Values
Finding a reproducible case for this issue has been difficult. So, I created a Power BI report that you can easily download: Example RANKX Issue Model and you can download the source data (Excel file) download both here.
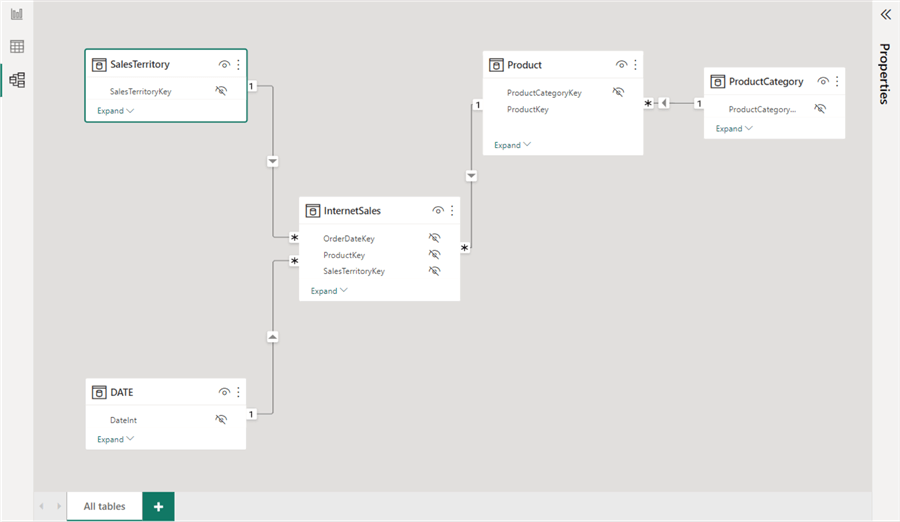
For this tip, I created a model composed of one Fact table (InternetSales) and 4 Dimensions (DATE, Product, ProductCategory, and SalesTerritory), as shown in the image below.

Let's assume that someone from the Sales Department requests a report that shows the following KPIs:
- Product Category Rank According to Order Quantity
- Product Category Rank According to Sales Amount
So, most of us would write the following two measures:
Product Category Rank According to Quantity =
 RANKX (
        ALL(ProductCategory[EnglishProductCategoryName]),
        [Order Quantity],,DESC, Dense
    )
Product Category Rank According to Sales Amount - Return wrong results =
 RANKX (
        ALL(ProductCategory[EnglishProductCategoryName]),
        [Sales Amount],,DESC,Dense
    )
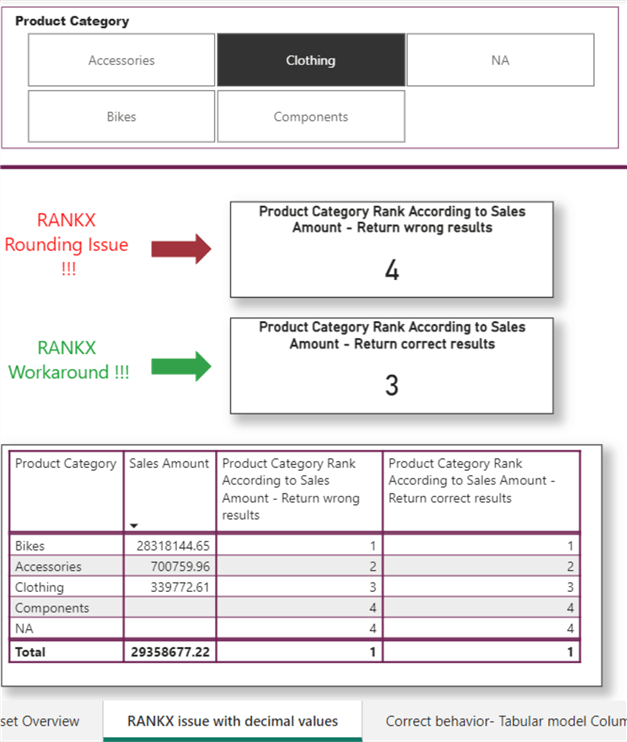
Without filtering the report, everything works fine, and the Product Category Rank According to Sales Amount shows values from 1 to 4. However, when you select the Clothing Category, you see that the ranking is wrong in the card visual; the measured value is higher than the number of available categories. Please note that I disabled the interaction between the Product Category filter and the Table to see each category's actual and correct ranking.

It's important to note that Microsoft has advised caution when utilizing the RANKX function. Microsoft says:
"Equality related comparisons (=, < >, >= and <=) between values with the Decimal Number data type can potentially return unexpected results when using the RANKX function. Incorrect results can occur because values with Decimal Number data type are stored as IEEE Standard 754 floating point numbers and have inherent limitations in their precision. To avoid unexpected results, change the data type to Fixed Decimal Number or do a forced rounding using ROUND." (Microsoft Documentation)
However, I have realized that utilizing the CURRENCY function to CAST the DAX expression in the Expression parameter is the most effective way to tackle this problem in multiple datasets. The function resolves the issue by rounding up the fifth significant decimal.
So, we will rewrite the previously created measure as so:
Product Category Rank According to Sales Amount - Return correct results =
 RANKX (
        ALL(ProductCategory[EnglishProductCategoryName]),
        CURRENCY([Sales Amount]),,DESC,Dense
    )
Tabular Model Column Sort and Its Effect on RANKX
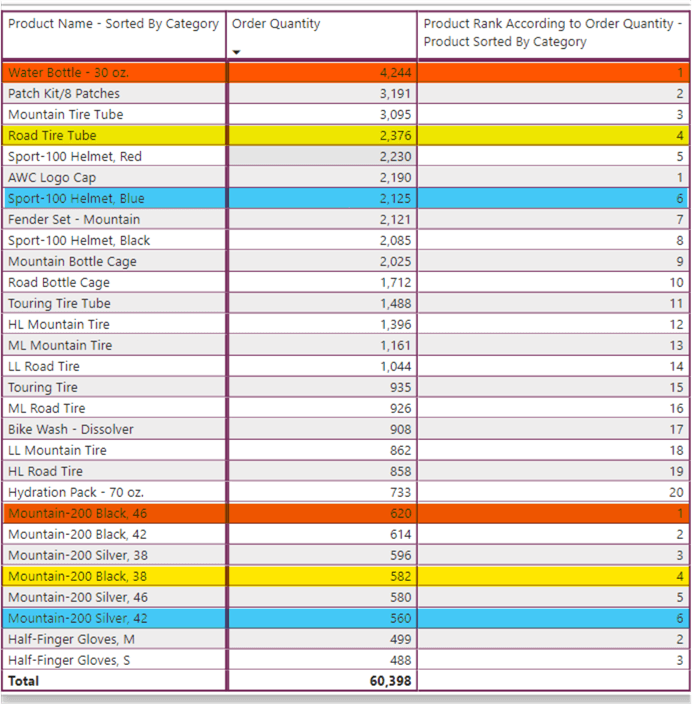
While preparing the Power BI reports reproducing the RANKX issue with decimals values, as a startup measure, I wrote a RANKX measure on a whole number value with complete confidence, knowing nothing could go wrong. I added the measure to a table visual to show Product Rank According to Order Quantity, but something was wrong—it was giving the same ranking for different products.
Product Rank According to Order Quantity =
IF (
     HASONEVALUE(Product[EnglishProductName]),
    RANKX (
            ALL(Product[EnglishProductName]),
            [Order Quantity],,DESC,Dense
        )
    )
I stumbled for a few minutes, and I was sure the measure was correct, and the data in the Product Dimension was consistent.
So, I revisited my model preparation steps and discovered that due to one of my Organizing OCD steps, the Product name column was sorted by the Product Category key on the Product table, which caused the unexpected behavior. To get the required behavior, I sorted the column using its values.

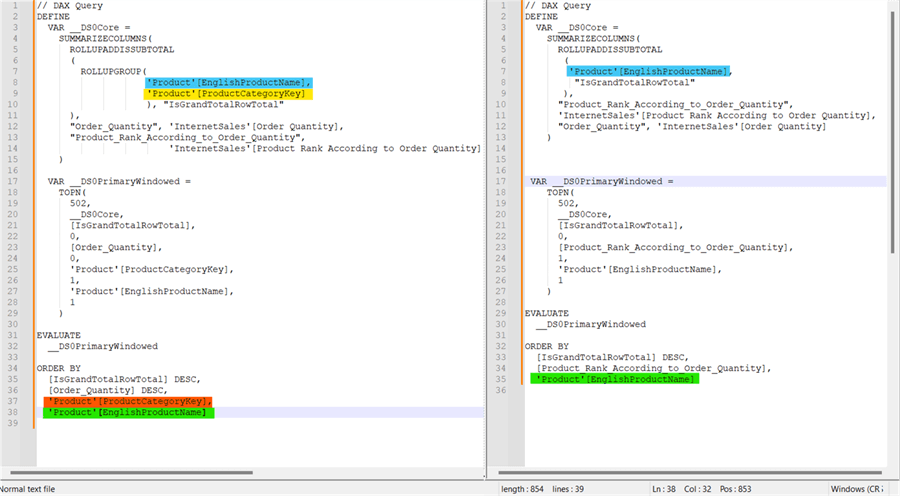
To investigate this behavior, I reproduced it again and got the DAX query using Power BI Performance Analyzer.

The DAX query comparison shows that when we have a Sort by Column applied on a column, every time we include that column in a report, Power BI also includes the corresponding sort by column in the same DAX query. So, the unexpected behavior was that the ranking measure populated its result on two columns: one explicitly included in the measure and the one we are sorting on.
If you are new to Power BI Performance Analyzer, check out these links for more information:
- Power BI Performance Analyzer
- Use Performance Analyzer to examine report element performance in Power BI Desktop - Power BI | Microsoft Learn
In conclusion, when we apply the Sort by Column in the data model, we should verify whether the column is used in some iterator and if this could affect the evaluation of any previously created measures.
Next Steps
- Read more about DAX formula expression language.
- Read more about Data Modeling in Power BI.
Learn more about Power BI in this 3 hour training course.
About the author
 Aseel AL-Laham is a Business Intelligence (BI) Specialist with over eight years of experience in the BI field. She started as a QA engineer for BI & Databases, which opened the path to becoming a BI Specialist with a QA soul.
This author pledges the content of this article is based on professional experience and not AI generated.
View all my tips
Article Last Updated: 2023-06-16


