By: Kenneth A. Omorodion | Updated: 2023-06-29 | Comments (3) | Related: > Power BI
Problem
In data warehousing, there are various techniques to identify the most recent records in a dataset. Some of these techniques do not accommodate historical records, while others do. The most popular method in data warehousing to identify the most recent records while also adjusting for historical traces of the records is the Slowly Changing Dimension (SCD) Type 2 implementation.
For those not from a data warehousing background, the term SCD Type 2 might be a complex term. However, it is simply a concept that refers to when you need to identify the most recent records of data and, at the same time, need to be able to see the historical records as well. Also, note that there are other types of slowly changing dimensions, which can be found in this article: Slowly changing dimension.
How do we implement this in Power BI? Or how do we approach identifying the most recent records in a dataset while still accommodating historical records in Power BI?
Solution
It should be noted that this tip does not describe how you can implement SCD Type 2 in Power BI. Instead, it describes an approach you can use to identify the most recent records in your dataset and retain historical records for robust reporting. If you need to understand how to approach implementing SCD Type 2 in Power BI, there are links to other sources and videos in the Next Steps section at the end of this article.
To facilitate the process, I have used the dataset in the image below for demo purposes.

The dataset assumes that employee details are updated when changes are made. In the dataset above, updates have been made on some employee details over a three-month period.
As you can observe on the dataset above and in the image below, employee ABC001 used the address "1, John Street, London", on 31 January 2022, but updated it to "2, Doe Street, London", on 2 February 2022. So, the latest accurate address for employee ABC001 would be the one entered on 2 February 2022. If they made any updates on the records in March, this would be his latest accurate record. The image below shows all updates for all employees over the three-month period.
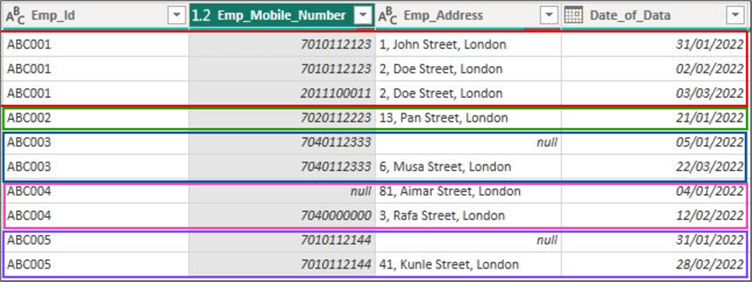
From the image above, you can also see that employee ABC002 has not updated his records over this period. Thus, we expect his current record to remain the same, and the last update date should remain 21 January 2022. Employee ABC003 made one update in March 2022, which was on his address details, and so on.
So, how do we dynamically identify the most recent records for each employee (or customers, students, tenants, etc.)? Everything needs to be set up in Power Query, and I have outlined the steps below.
Step 1: Import the Dataset into Power BI (Power Query)
To import the dataset, you need to connect to the source data using the appropriate connector in Power BI. In this demo, I have connected using a CSV file in the SharePoint folder. To read more on how to do this, please see the Microsoft documentation in the Next Steps section at the end of this tip.
Step 2: Create a Grouping on the ID Column (Unique ID Column)
Emp_Id is the ID column for this demo, which may be different in your case. Make sure to identify which column is the unique identifier column.
Click on the ID column, and select Group By on the home tab ribbon, as seen in the image below.
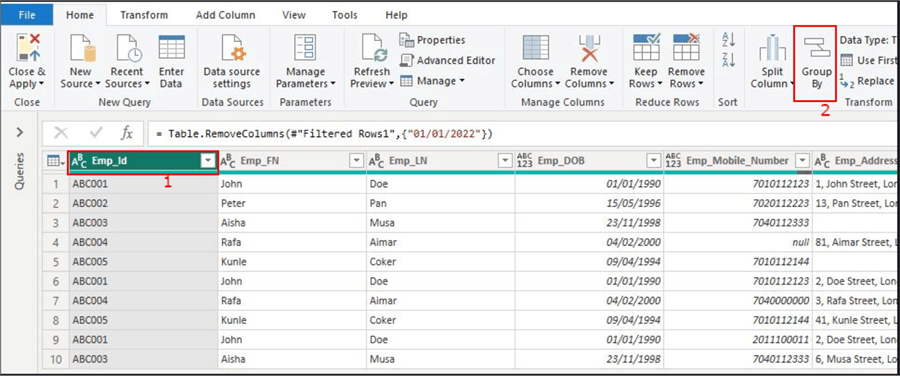
Or this can also be done by selecting the ID column, right-clicking on it, and selecting Group By, as seen in the image below.

The window below appears. Select Advanced, as seen in the image below.

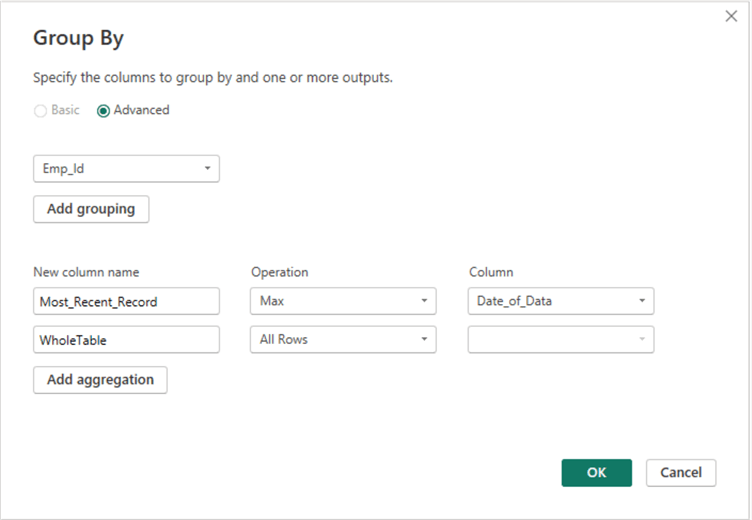
Next, we need to create two groupings, one for the most recent date (Most_Recent_Record) and one for the other columns on the table (WholeTable). The "Most_Recent_Record" looks at the "Date_of_Data" column and determines the most recent date for each Emp_Id grouped.
As seen below, I have applied a "Max" operation for the Most_Recent_Record. Also, I have used an "All Rows" operation for the "WholeTable" new column. Click OK.
The grouped table should now look like this:

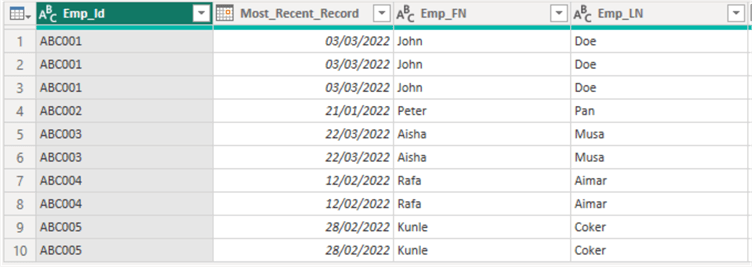
Next, expand the "WholeTable" column to reveal the other columns on the table, as seen in the image below. Click OK.

The image below shows a table with a column for each employee's most recent recorded updates.
Step 3: Create the Current Record Identity Column
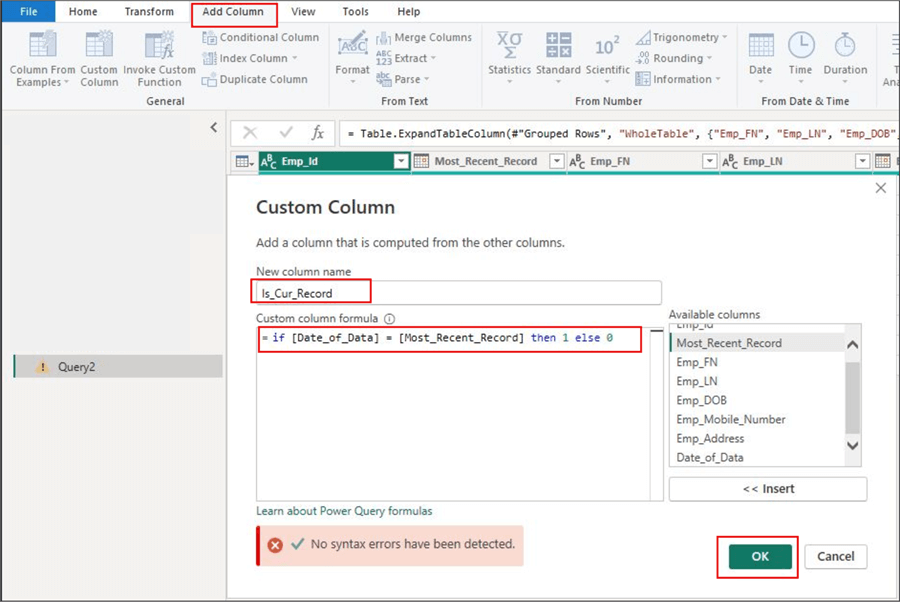
The purpose of creating the current record identity column is to simplify reporting. This column looks at the date column that came with your data (in this case, the "Date_of_Data" column), compares it to the date of the most recent records column, and signifies if it's the most recent record row of data. You can use this new column to help create a filter context in your DAX later.
To create this column, do as shown in the image below.
The output of this new column should look like the one in the image below. As per the M Query above, 1 represents the most recent records, while 0 represents older records.
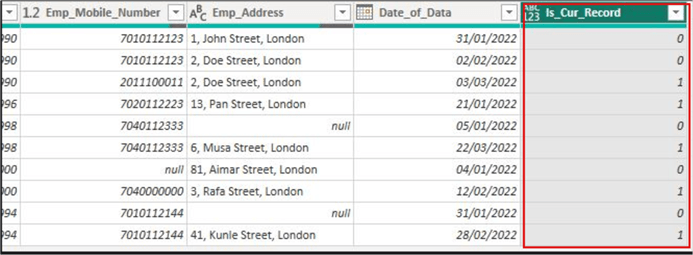
You can also change the column's datatype to True/False as shown below.

In summary, we successfully demonstrated how to dynamically identify the most recent records in a dataset while maintaining a view of the historical records. This is one of many approaches to achieving this business requirement. It would be great to know how others have implemented this too. As noted throughout this tip, helpful links are included in the next section to study further and research this topic.
Next Steps
- Connect to datasets in the Power BI service from Power BI Desktop.
- Working with Slowly Changing Dimensions in Power BI.
- Slowly Changing Dimension (SCD) in Power BI, Part 1, Introduction to SCD.
- Keep most recent record on a table with Power Query.
Learn more about Power BI in this 3 hour training course.
About the author
 Kenneth A. Omorodion is a Business Intelligence Developer with over eight years of experience. He holds both a bachelorís and masterís degree (Middlesex University in London). Kenneth has the MCSA, Microsoft Data Analyst - Power BI and Azure Fundamentals certifications. Kenneth is a Microsoft Certified Trainer and has delivered corporate training on Power BI, SQL Server, Excel and SSRS.
This author pledges the content of this article is based on professional experience and not AI generated.
View all my tips
Article Last Updated: 2023-06-29


