By: Mehdi Ghapanvari | Updated: 2023-07-17 | Comments | Related: > Performance Tuning
Problem
SQL Server estimates how many rows will return from an operator in an execution plan and this is based on statistics. The estimated number of rows will be wrong when the statistics are outdated. In some cases, even when the statistics are up-to-date, SQL Server still does not have an accurate estimation. In this article, we will learn how to improve query performance when the estimated number of rows is wrong and updating statistics does not help.
Solution
Up-to-date statistics are vital for query performance. Insert, update, delete, or merge operations change the data distribution in the table, which causes statistics to become out-of-date. There are settings at the database level that can be used to update statistics automatically, but as your database grows and data changes, there may be a need to update statistics manually. You can do this with a weekly job or even more frequently if needed.
SQL Server statistics are system objects that contain information about data distribution in the index key values and, sometimes, in regular column values. SQL Server creates statistics for each index and uses it during query optimization. It helps SQL Server estimate how many rows will be returned for an operation in the query plan.
Statistics are limited in size and only use one 8KB page. Each statistic has three parts and the third part is the histogram which is the distribution of the data and statistics only have up to 201 steps in the histogram. Each step stores information about larger key intervals. The problem sometimes arises when we query for a shorter key because they are not big enough to be one of the 201 steps in the statistics histogram. Updating the statistics does not fix the problem, but we can rewrite the query to solve the problem which we will see in this article.
Set Up Test Environment
I'll use the Stack Overflow database and create an index on the DisplayName column in the Users table. Stack Overflow database is an open-source database from Stack Overflow.com.
CREATE INDEX IX_DisplayName ON dbo.Users (DisplayName)
WITH (DATA_COMPRESSION = PAGE)
GO
The following script creates a temporary table, inserts some values, and then joins it with the Users table based on the DisplayName column. The purpose of the script is to find the related information of the values from the user's table and sort them by the reputation column.
SET STATISTICS TIME ON
DROP TABLE IF EXISTS #Tbl_DisplayName
CREATE TABLE #Tbl_DISPLAYNAME
(DisplayName NVARCHAR(40) COLLATE SQL_LATIN1_GENERAL_CP1_CI_AS)
INSERT INTO #Tbl_DisplayName VALUES (N'Marco'), (N'Alexo'), (N'Jan'), (N'Ashish'), (N'William'), (N'Vishal'), (N'Charles'), (N'Venkat')
SELECT u.DisplayName, u.Location, u.CreationDate,
       u.Reputation, u.DownVotes, u.UpVotes,
       u.AccountId, u.Views, u.WebsiteUrl, u.LastAccessDate
FROM dbo.Users u INNER JOIN #Tbl_DisplayName d
 ON u.DisplayName = d.DisplayName
ORDER BY Reputation DESC
GO
To see the query execution time and the CPU time, we can use the command below:
SET STATISTICS TIME ON
If we execute the query with actual execution plans enabled, we get the following plan:
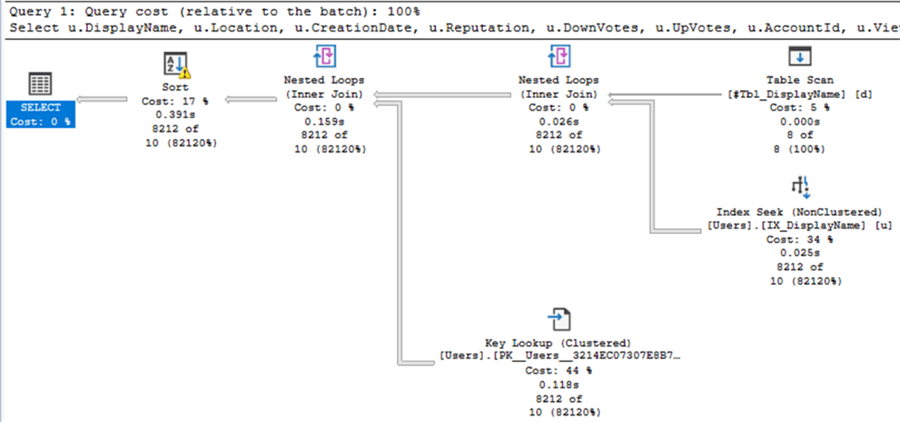
As we can see in each step, SQL Server thinks ten rows will come back, but we get 8,212 rows back.
Look at the index seek operator in the execution plan. The estimated number of rows is ten, and the actual number of rows is 8212. When the row estimate is wrong, the memory grant will be wrong. The memory allocated to the query is low due to underestimating rows. It causes a spill-to-disk problem, as you can see in the warning on the sort operator.
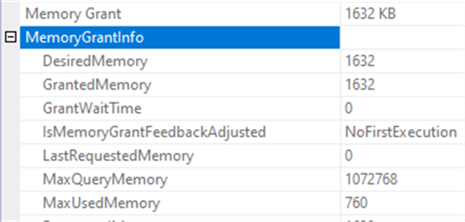
If you right-click the Select operator in the actual execution plan and then click properties, the properties windows will open. In the window, you can see Memory Grant. The following image shows that the granted memory is just 1632 KB.
The following image shows query execution time is 349ms:
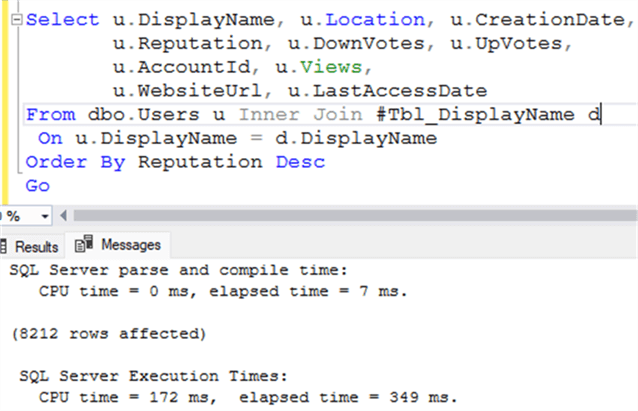
The elapsed time is 349ms, and the CPU time is 172ms. The query ran in serial mode, which means that SQL Server executed it with one logical CPU core. Also, you can see this by right-clicking the index seek operator in the Actual execution plan and then clicking properties. In the opened window, the Actual number of rows for all executions shows that SQL Server used one logical CPU core:

SQL Server must correctly estimate the number of rows in each step of a query execution to generate an efficient execution plan.
I'm going to update the Users table statistics:
UPDATE STATISTICS dbo.Users WITH FULLSCAN
Run the following command to clear all the query plans (Don't run this in production):
DBCC FREEPROCCACHE
Now I run the query above again:
SELECT u.DisplayName, u.Location, u.CreationDate,
       u.Reputation, u.DownVotes, u.UpVotes,
       u.AccountId, u.Views, u.WebsiteUrl, u.LastAccessDate
FROM dbo.Users u INNER JOIN #Tbl_DisplayName d
 ON u.DisplayName = d.DisplayName
ORDER BY Reputation DESC
GO
The following image shows the actual query execution plan after updating the statistics:
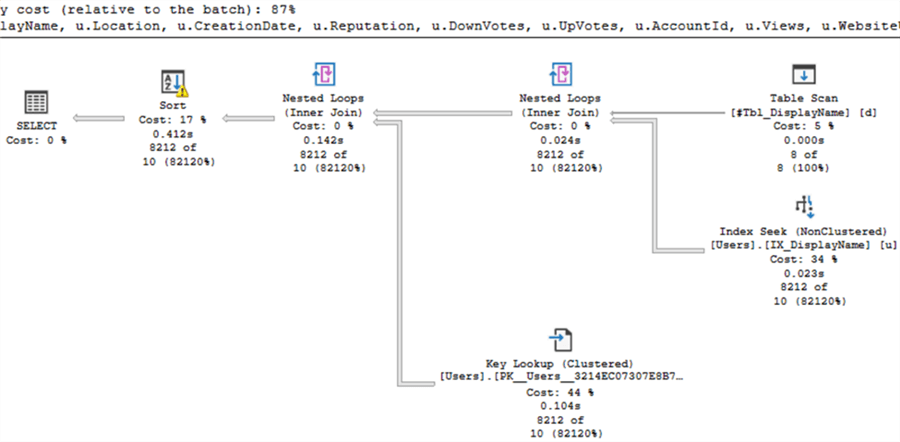
As you can see, all the problems remain. So, I'm going to rewrite the query. The Users table has a clustered primary key on the Id column. I find the IDs for each DisplayName and put them all in a temporary table as follows:
DROP TABLE IF EXISTS #Temp
SELECT u.Id INTO #Temp
FROM dbo.Users u INNER JOIN #Tbl_DisplayName d
 ON u.DisplayName = d.DisplayName
GO
The estimated number of rows for this part of the query is still wrong, but it doesn't matter because the query execution time is a few milliseconds.
The following images show this:

After it, I write the query below so that it joins the temporary table with the user's table based on the Id column.
SELECT u.DisplayName, u.Location, u.CreationDate,
       u.Reputation, u.DownVotes, u.UpVotes,
       u.AccountId, u.Views, u.WebsiteUrl, u.LastAccessDate
FROM dbo.Users u INNER JOIN #Temp t
 ON u.Id = t.Id
ORDER BY Reputation DESC
GO
The following image shows the actual query execution plan after rewriting the query:
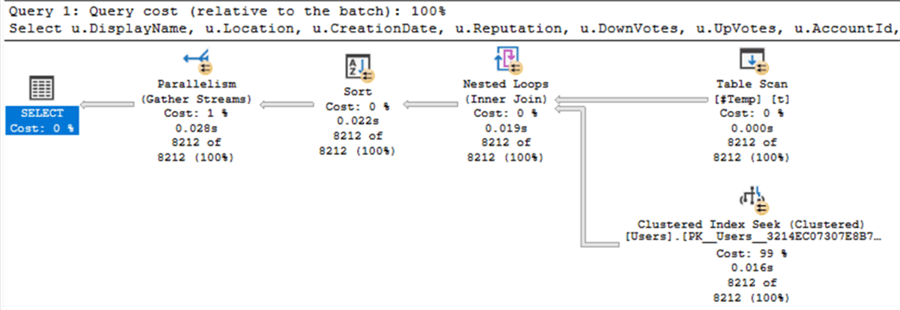
The estimated number of rows is now the same as the actual number of rows for all operators. There is also no yellow warning in the execution plan.
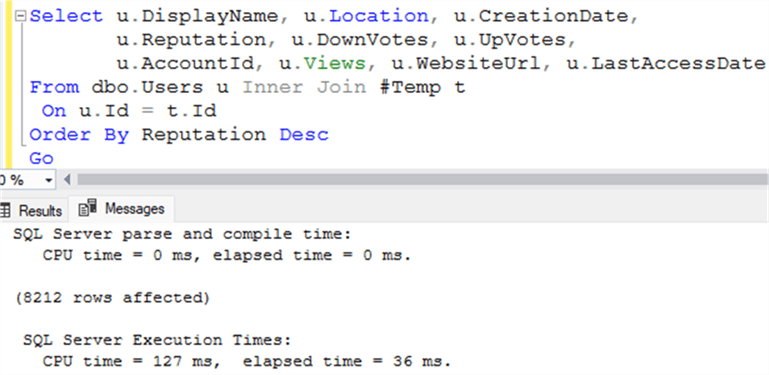
The following image shows query execution time is 36ms and the CPU time is 127ms. The query ran in parallel mode.
The following image shows the granted memory grew to 16 MB:

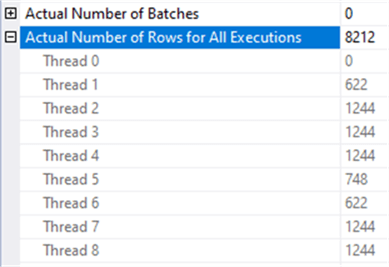
You can see in the image below, SQL Server used eight logical CPU cores to execute the query. It shows the number of rows processed by each worker (thread).
Summary
SQL Server uses statistics to build an execution plan. Up-to-date statistics are vital, but sometimes updating statistics does not improve query performance. In these cases, we can rewrite the query to improve cardinality estimation if rewriting the query is possible.
Next Steps
- Importance of Update Statistics in SQL Server
- Checking SQL Server Query Cardinality Estimator Version
- Correct SQL Server TempDB Spills in Query Plans Caused by Outdated Statistics
- SQL Server Temporary Table Caching
About the author
 Mehdi Ghapanvari is an SQL Server database administrator with 6+ years of experience. His main area of expertise is improving database performance. He is skilled at managing high-performance servers that can handle several terabytes of data and hundreds of queries per second, ensuring their availability and reliability.
This author pledges the content of this article is based on professional experience and not AI generated.
View all my tips
Article Last Updated: 2023-07-17


