By: Koen Verbeeck | Updated: 2023-10-20 | Comments | Related: > Microsoft Fabric
Problem
We currently use Azure Synapse Analytics Spark Pools to run notebooks with PySpark and SparkQL code. We are looking into Microsoft Fabric as an alternative since all needed services are available on one data platform. Can we run notebooks in Microsoft Fabric as well?
Solution
Microsoft Fabric is Microsoft's new end-to-end unified analytics platform, which integrates several existing technologies. One available compute service is the lakehouse, introduced in the tip, What are Lakehouses in Microsoft Fabric. A lakehouse is a combination of a datalake to store the files – in Fabric, this is called OneLake, and the lakehouse tables are stored as Parquet files with the Delta format – and a compute service where you can model your data warehouse. When you create a new lakehouse in Fabric, a SQL endpoint is created automatically, allowing you to query the data in your lakehouse tables using the SQL query language. There's even the possibility to create your SQL queries visually, as shown in the image below.
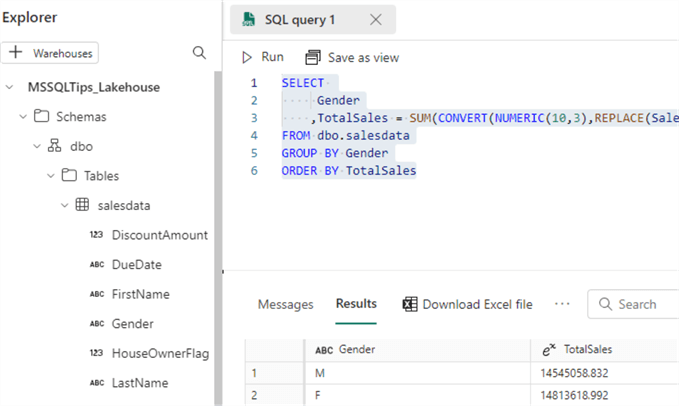
However, it's also possible to create notebooks to execute more complex code written in PySpark, for example. This tip will show how to create a notebook and access your data in Fabric.
Create a Notebook
If you don't have a Fabric lakehouse already, you can follow the steps in this previous tip What are Lakehouses in Microsoft Fabric to create one. Also, make sure you have a Fabric-enabled workspace. Check out What are Capacities in Microsoft Fabric to learn more.
In Fabric, choose the Data Engineering persona. If you're wondering what personas are, check out the tip called Microsoft Fabric Personas.
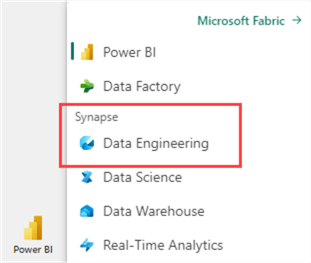
You'll be presented with options, such as creating a new lakehouse, notebook, or Spark Job definition. Click on Notebook.
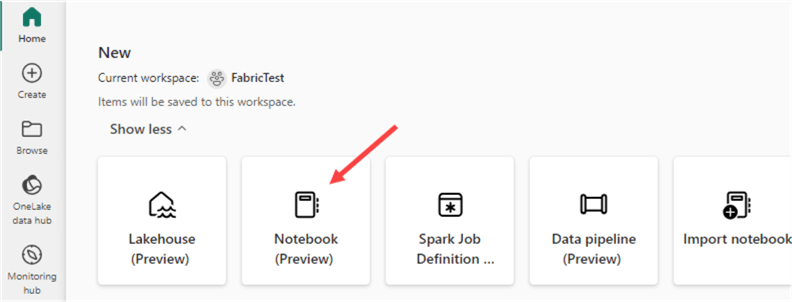
A blank notebook will open.
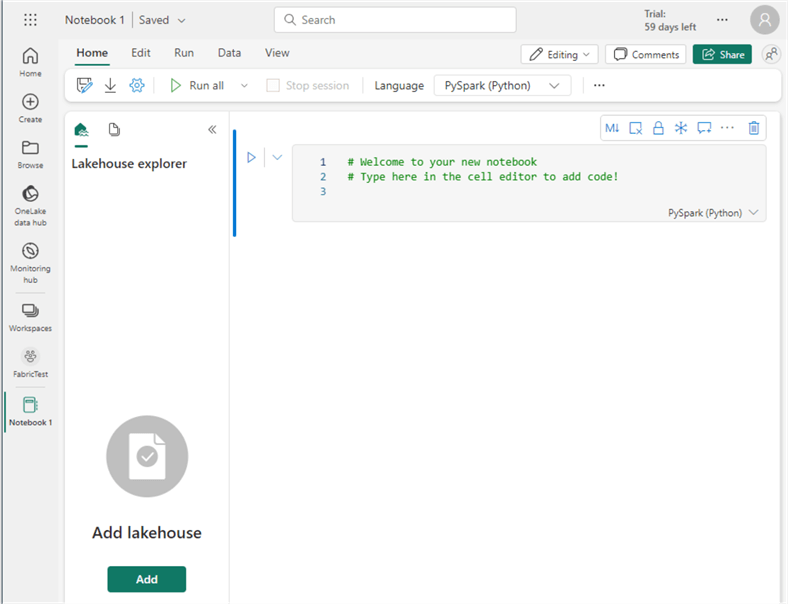
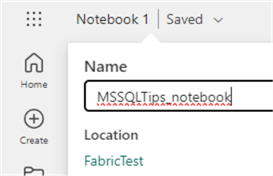
In the top left corner, you can change the name of the notebook:
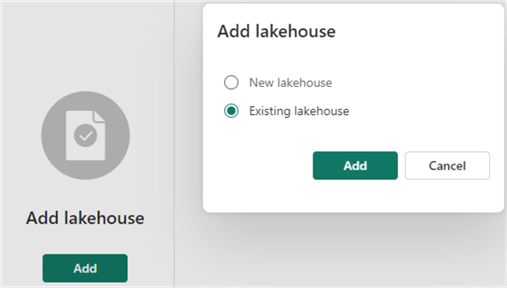
In the Lakehouse explorer, you can add an existing lakehouse to the notebook or create a new one.
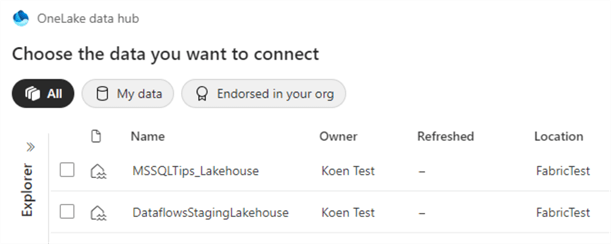
When adding an existing lakehouse, you'll be taken to the OneLake data hub, where you can choose between existing lakehouses.
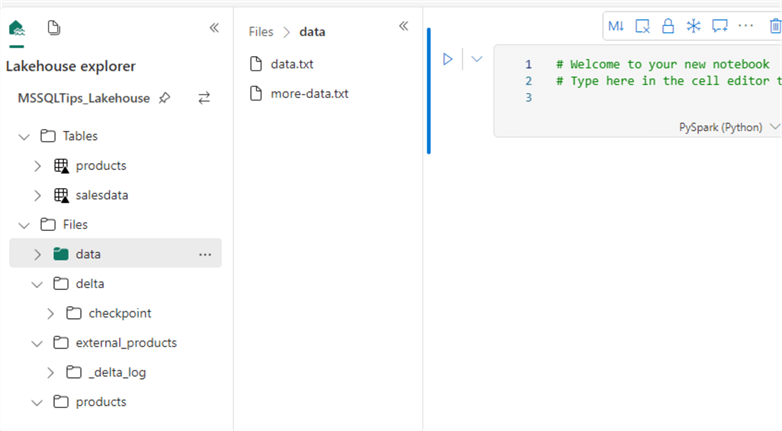
Once you've chosen the lakehouse, it will be added to the notebook, and you can view existing tables, folders, and files in the Lakehouse explorer.
Another opportunity to create a new notebook is when you're inside the lakehouse itself. You can create a new notebook or open an existing one there.
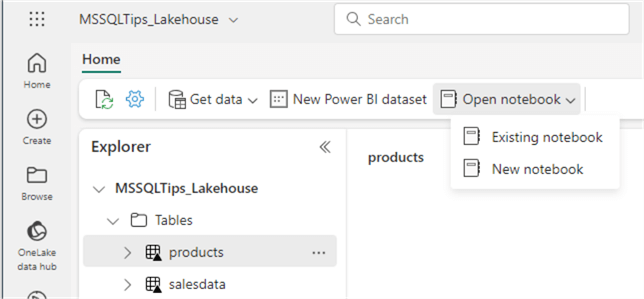
Let's load the SalesData.csv file to a table using PySpark. We already loaded this data to a table using the browser user interface in the tip What are Lakehouses in Microsoft Fabric. Now, we will discover how we can do this using code only.
At the top of the notebook, choose its main language. Make sure to set it to PySpark.
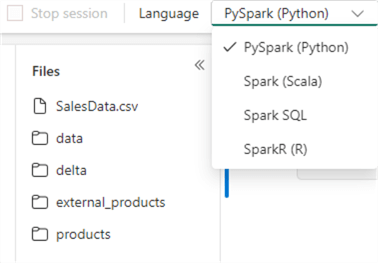
In a notebook cell, enter the following PySpark code and execute the cell. The first time might take longer if the Spark session has yet to start.
df = spark.read.format("csv").option("header","true").option("delimiter",";").load("Files/SalesData.csv")
display(df)
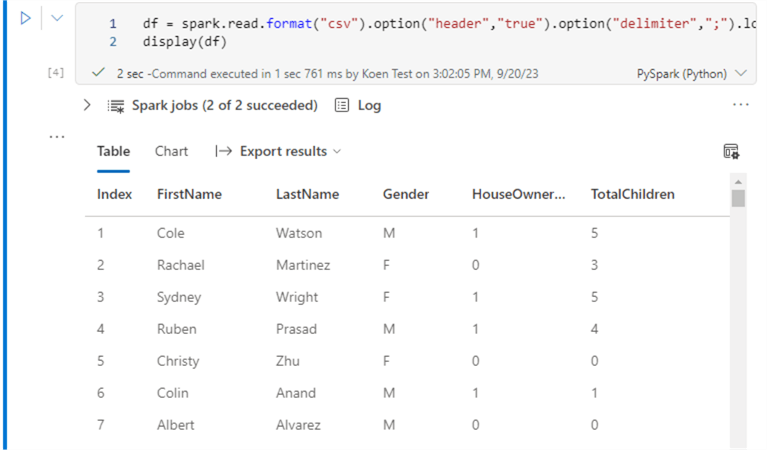
The data is now loaded into a Spark DataFrame (not to be mistaken with a Pandas dataframe. They're similar, but not exactly the same). We can check how many rows we've loaded with the following statement:
print(df.count())
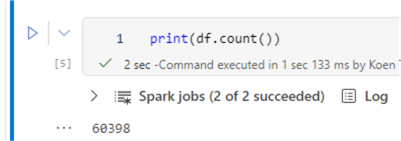
Now, let's add a year and month column based on the order date using the following script:
from pyspark.sql.functions import *
## Create Year and Month columns
df_yearmonth = df.withColumn("OrderYear", year(col("OrderDate"))).withColumn("OrderMonth", month(col("OrderDate")))
display(df_yearmonth.limit(10))
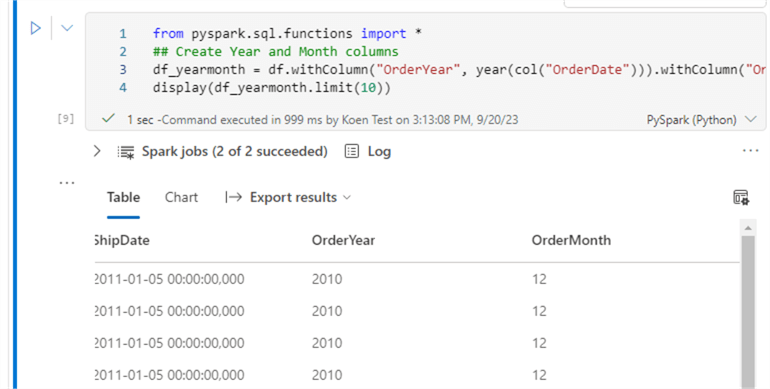
Now, we will save the data back to files but partition it. Partitioning can speed up performance when you filter the data. For example, if we filter on the year 2010, the compute engine only needs to read data from that specific partition. We can write the data with partitioning using the following command:
df_yearmonth.write.partitionBy("OrderYear","OrderMonth").mode("overwrite").parquet("Files/sales_partitioned")
After executing the command and refreshing the Files folder in the Lakehouse explorer, we can see the data is now saved in a bunch of folders. Each folder name has the following structure: "partitioncolumn = partitionvalue". The top-level folders are the order year folders. In such a folder, we have subfolders for each order month.
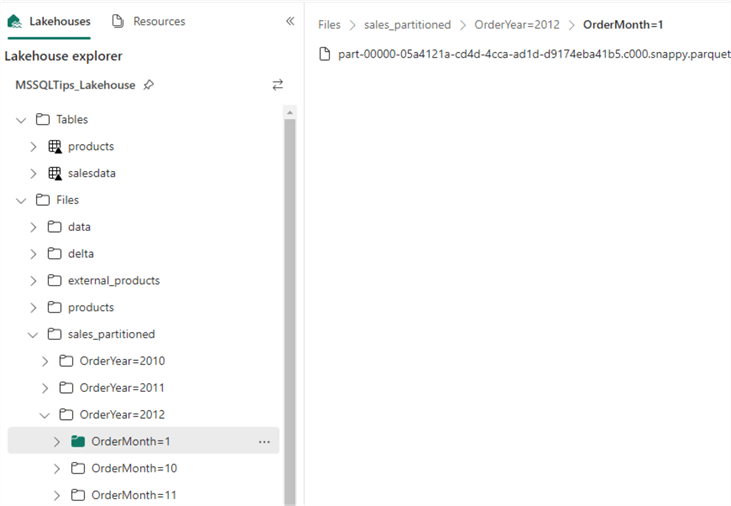
Inside the month folder, we can find a Parquet file. Partitioning is usually overkill for such a small dataset since we create too many small files. Parquet benefits from larger files since the compression can then be more efficient.
How to Configure the Spark Node Size
In our notebook, we saw that a Spark session must be started to execute the code (which will start automatically), but there are no settings for the compute power of this session. These can be configured on the workspace level.
In the workspace, click on the ellipsis to go to its settings.

In the Data Engineering/Science section, you can find the Spark compute pane.
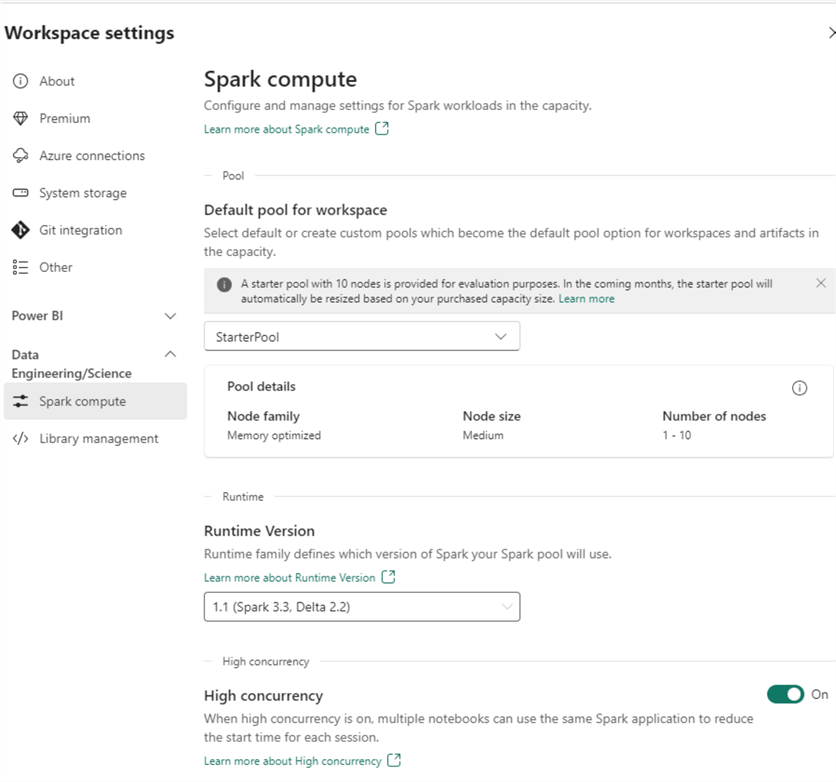
As you can see, a starter pool of 10 nodes is provided by default in the trial. (This might change later when the trial is over.) The starter pool is why the Spark session can start so quickly: it's compute power that's already been reserved by Microsoft and is ready to be used. You also have the option to create your own pool to set as the default pool for the workspace. What's interesting is that you can define a single-node pool, which is great for development purposes:
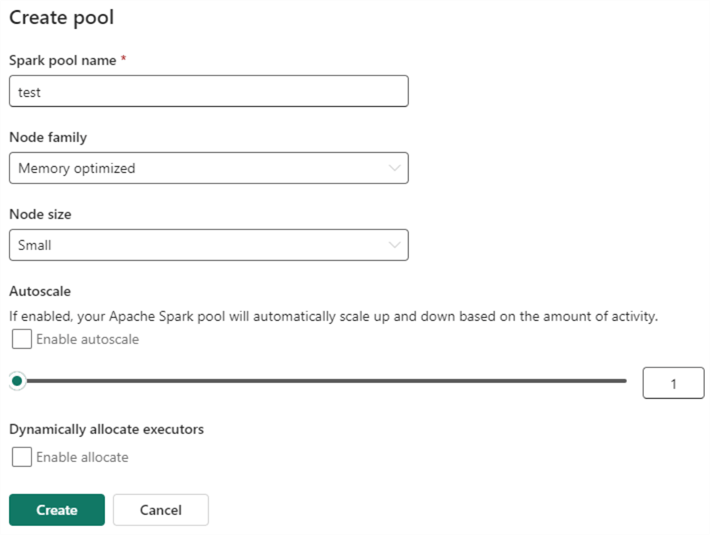
You might wonder: why is there a setting for the Spark node size? Isn't compute handled by the Fabric capacity? Yes, it is. But Spark compute isn't the only type of compute in Fabric. You also have the SQL endpoints, Kusto, Power BI, etc. When you run your Spark notebooks, it takes a certain amount of your capacity that others can't use. By lowering the node size, you have more compute left for other workloads.
Next Steps
- If you want to follow along with the examples, download the CSV file here.
- You can find more Fabric tips in this overview.
- Getting Started with Python and Jupyter Notebooks under VS Code
- Data Exploration with Python and SQL Server using Jupyter Notebooks
- Explore Spark databases with Azure Synapse Analytics
About the author
 Koen Verbeeck is a seasoned business intelligence consultant at AE. He has over a decade of experience with the Microsoft Data Platform in numerous industries. He holds several certifications and is a prolific writer contributing content about SSIS, ADF, SSAS, SSRS, MDS, Power BI, Snowflake and Azure services. He has spoken at PASS, SQLBits, dataMinds Connect and delivers webinars on MSSQLTips.com. Koen has been awarded the Microsoft MVP data platform award for many years.
This author pledges the content of this article is based on professional experience and not AI generated.
View all my tips
Article Last Updated: 2023-10-20


