By: Koen Verbeeck | Updated: 2023-11-28 | Comments (2) | Related: > Microsoft Fabric
Problem
We have a couple of data services running in Azure; one of them is Azure Data Explorer. We want to migrate everything to a new centralized data platform in Microsoft Fabric. But is there an alternative for Azure Data Explorer in Fabric? Ideally, we would like to do some real-time analysis of time-series data.
Solution
In the new Microsoft Fabric – which is a unified end-to-end analytics platform – there are several types of data services available. We already discussed some of those compute services in previous articles:
There is another compute service available suited for real-time analytics: the Kusto Query Language (KQL) database. This service, also referred to as Synapse Real-Time Analytics, is derived from Azure Data Explorer (ADX). ADX enables you to do big data analysis on time-series data. Due to its columnar structure with efficient compression and a fast caching layer, you can run queries on top of millions or billions of rows. You can find an example use case where data is imported into ADX from Azure Cosmos DB in the tip Reading Azure Cosmos DB Data with Azure Data Explorer. ADX is also available as Kusto Pools in Azure Synapse Analytics and has now made its way into Microsoft Fabric.
This tip will guide you through an example of how to set up a KQL database and use its features. Keep in mind that Microsoft Fabric was still in preview when this tip was written, so screenshots or features might be different from your experience.
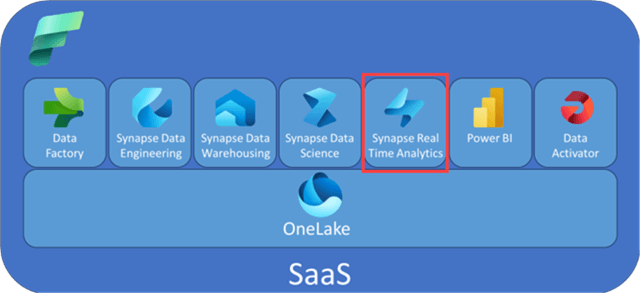
Building Your First KQL Database
After logging into the Power BI service, you can access the Kusto experience by selecting the Real-Time Analytics persona. For more information about the different personas in Fabric, check out the tip: Microsoft Fabric Personas.
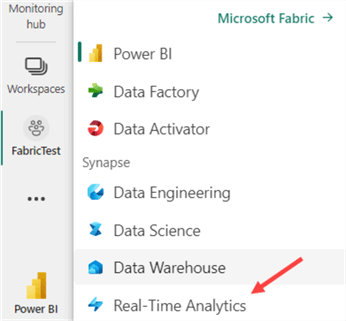
Kusto falls under real-time analytics because Microsoft has created a straightforward process to hook up the ingestion of your KQL database to an event hub. You can find more information about this in the documentation. If you haven't already, create a Fabric-enabled workspace. If you need assistance, check out the tip, What are Capacities in Microsoft Fabric?, to learn more about Fabric capacities.
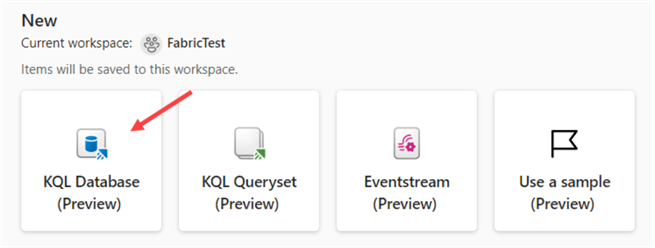
In the "Synapse Real-Time Analytics" experience, choose to create a new KQL Database:
Give the new KQL database a name and click Create.
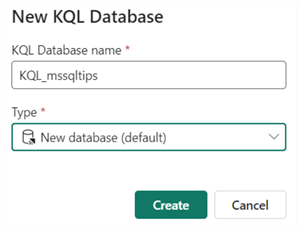
It might take a couple of seconds to create; however, it's a vast time improvement compared to creating an Azure Data Explorer cluster, which can last several minutes or longer.
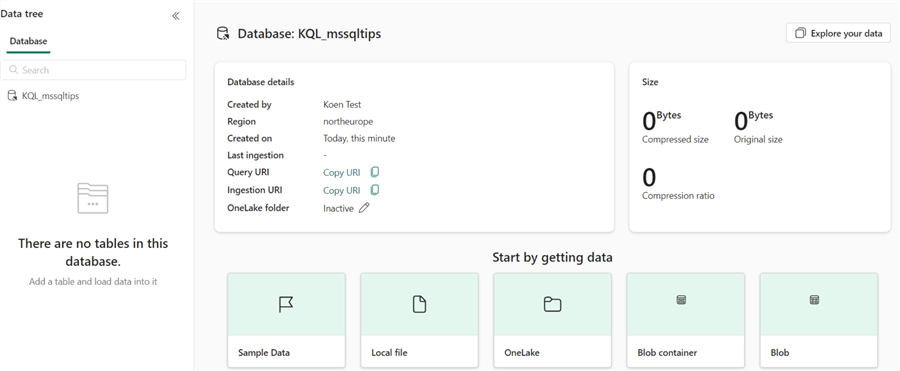
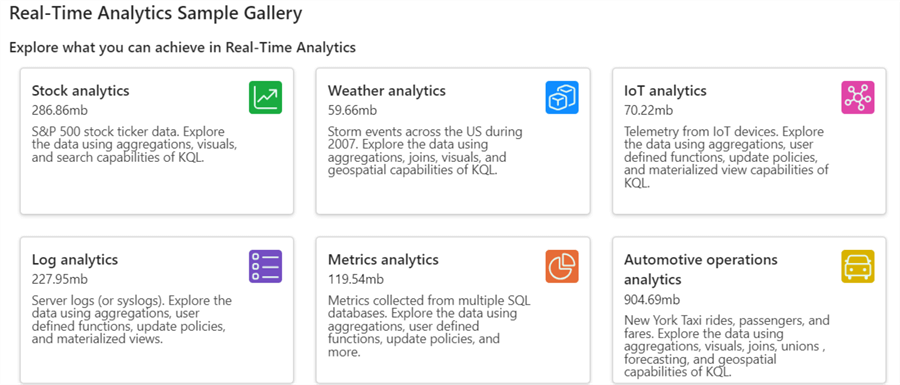
To try out the experience, there are ready-made sample data sets available by clicking on Sample Data under Start by getting data. A Real-Time Analytics Sample Gallery will appear.
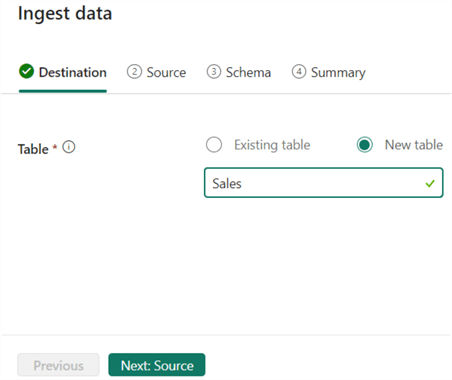
In the KQL database overview, click on Local file. First, specify the destination. Let's create a new table called Sales.
Next, upload the sample file containing sales data.
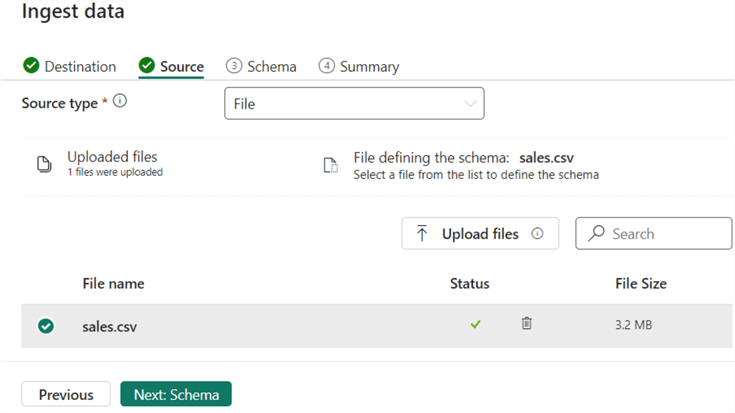
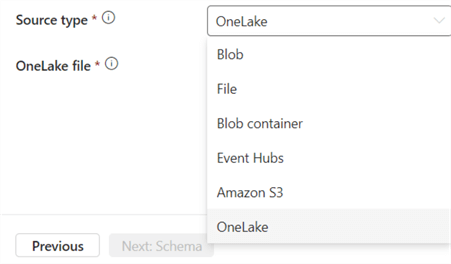
Besides uploading files (CSV or JSON), you can also use other data sources to retrieve data from:
For the Schema step, verify if everything is mapped correctly. Most likely, you can leave all the defaults.
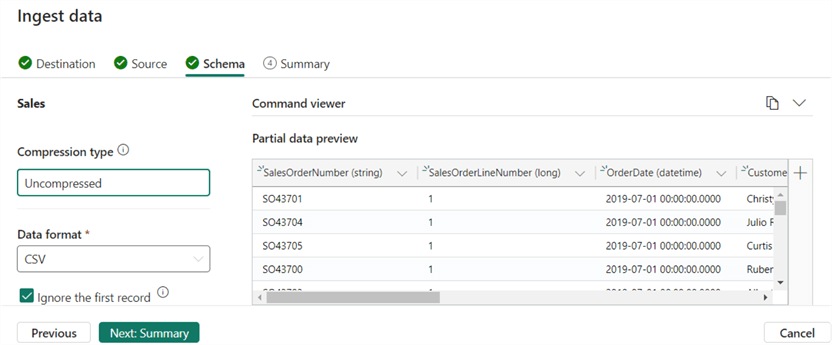
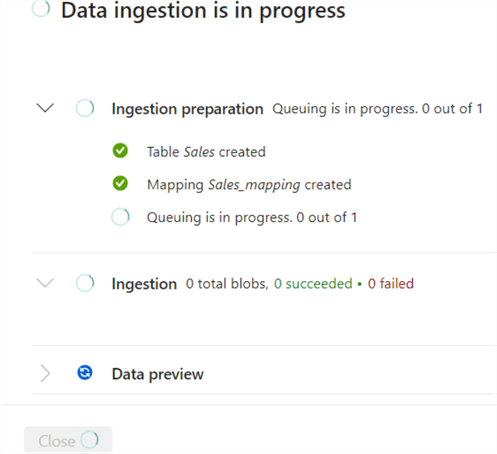
When you click on Summary, the data will already start loading.
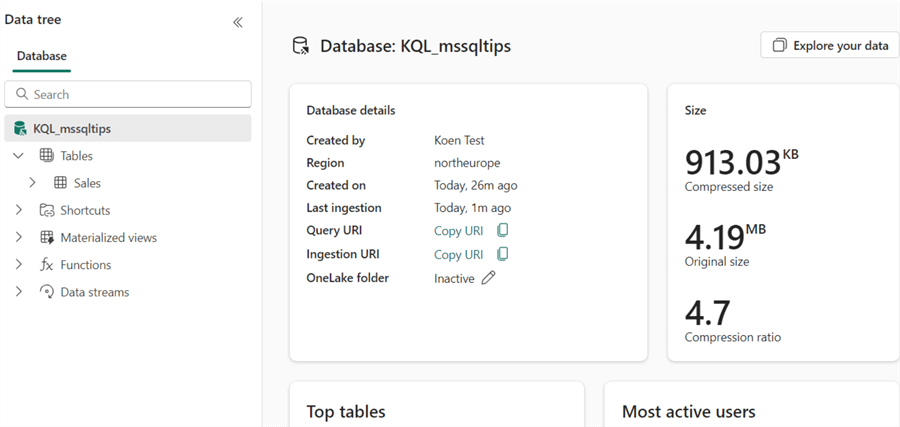
After the data is loaded, you'll get an overview of the size characteristics in the database pane.
When you click on the table, you'll get more specific information, such as the column data types, the size of the table itself, and the mapping.
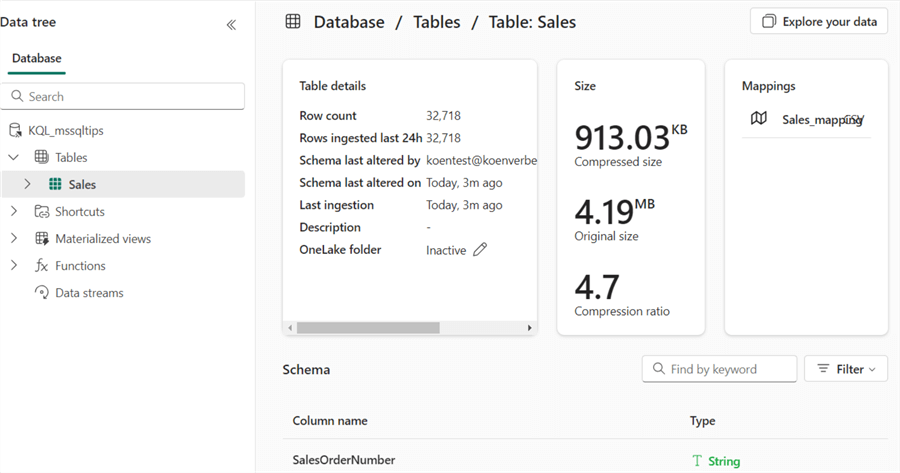
Inside a KQL database, the data is stored in a highly optimized format. However, the data can be exposed to the OneLake storage layer in the delta format. If you want to share your data within OneLake, you can change the OneLake folder property to Active.
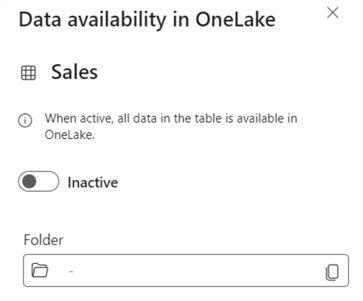
While we have the table selected, we can ask for the first 100 rows:
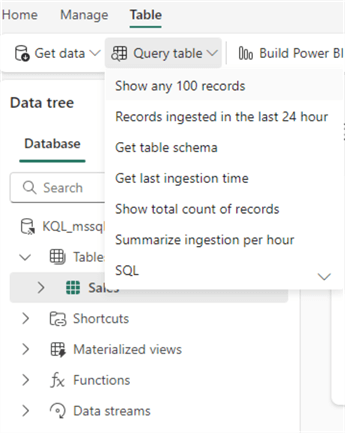
In a new side pane, you will get sample queries and the query result set:
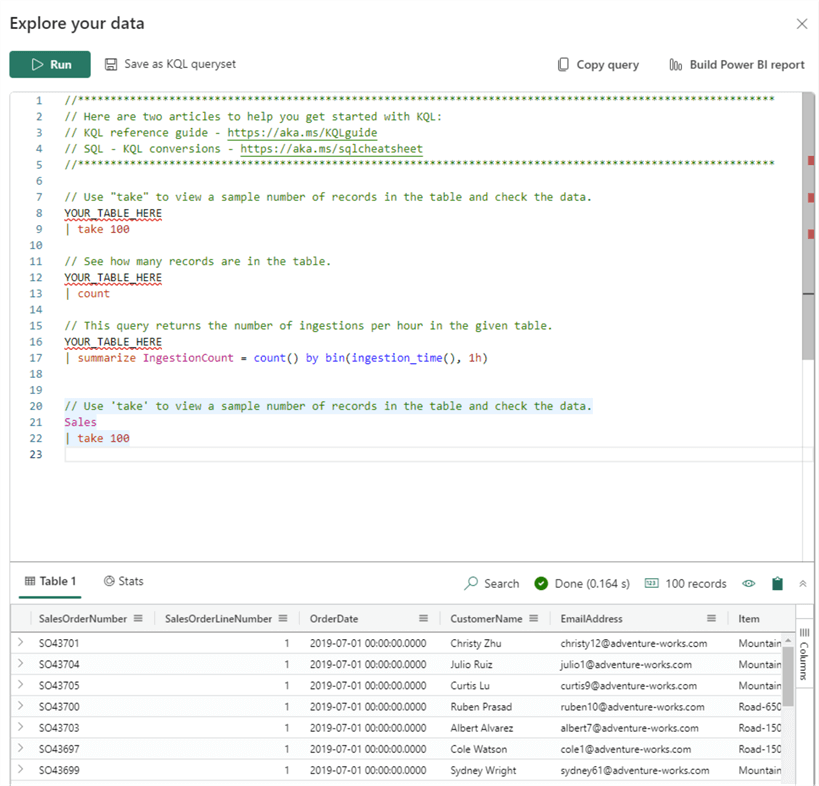
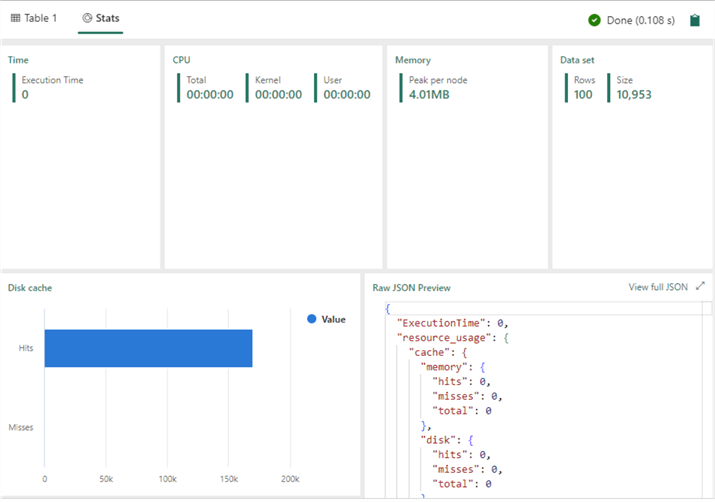
When clicking on Stats, you'll get query statistics, as well as a bar chart showing the cache hit ratio:
At the top, you can save the query as a KQL queryset.
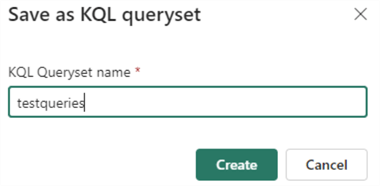
When you specify a name, it needs to be unique within the workspace. A queryset is a collection of one or more KQL queries. Each query can be connected to a different KQL database. Querysets are a means of sharing your queries with others.
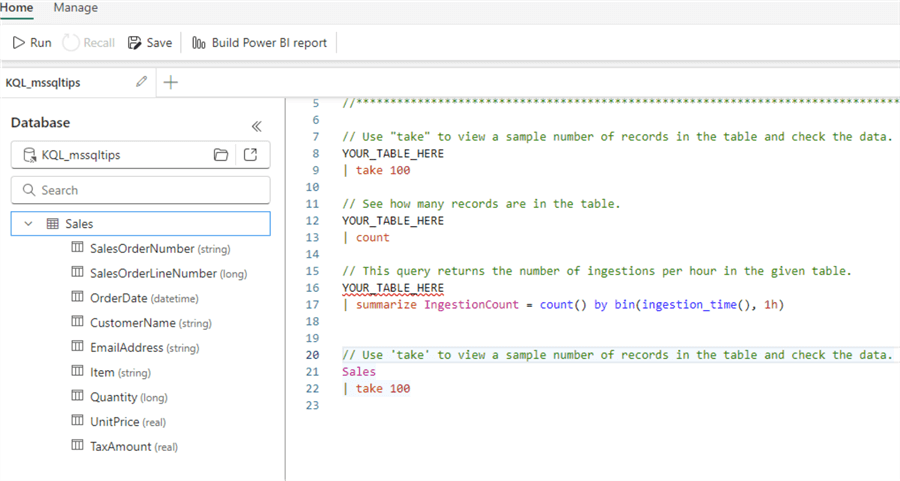
Now that we have data in our KQL database and a queryset, we can write KQL queries. If you're not sure how to start with KQL, you can always try the EXPLAIN command that will convert a SQL query to a KQL query:
EXPLAIN
SELECT Year(OrderDate) AS myYear, SUM(Quantity) AS ItemsOrdered
FROM Sales
GROUP BY Year(OrderDate)

You can copy the result and execute it to get similar results as the SQL query:

From the same dropdown in the KQL database (which we used to generate our first KQL query), we can see it's also possible to write SQL statements against the database directly:
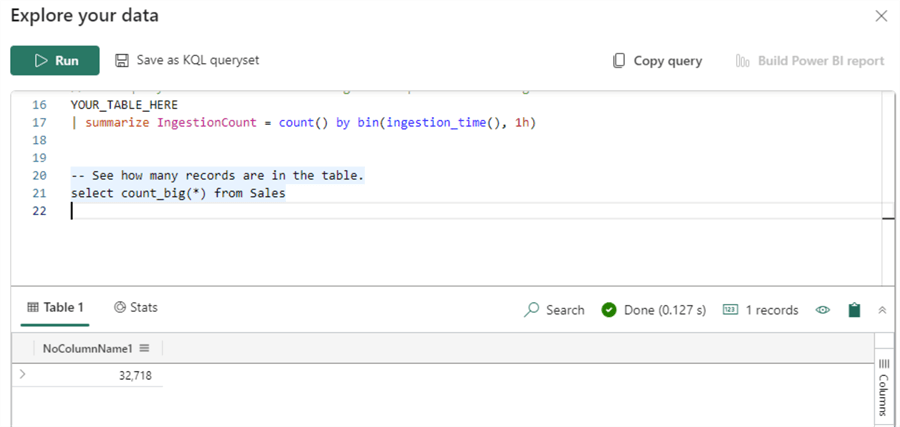
We could've just run our original SQL statement instead of translating it to KQL:
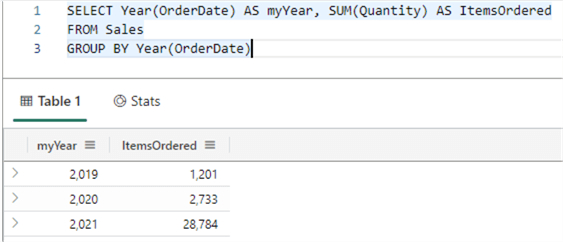
Why would we write KQL statements if most people are more familiar with writing SQL? Because KQL is a query language built for time-series analysis with specialized functions to help you. You can find examples in the documentation.
A simple example of a KQL query that visualizes the number of sales per day can be done with the following query:
let min_t = toscalar(Sales | summarize min(OrderDate));
let max_t = toscalar(Sales | summarize max(OrderDate));
Sales
| make-series num=count() default=0 on OrderDate from min_t to max_t step 1d
| render timechart
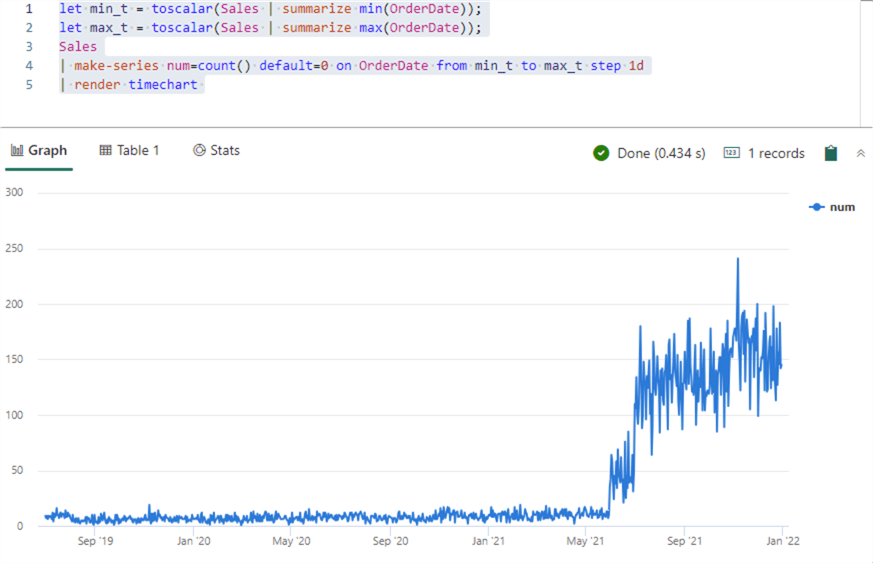
The beauty of the make-series operator is that if there are no sales for a given date, it automatically returns 0 for that day (configured by the default=0 parameter), so there are no gaps in the time series.
Like the other compute services (lakehouse and warehouse), you can directly build Power BI reports from your tables.
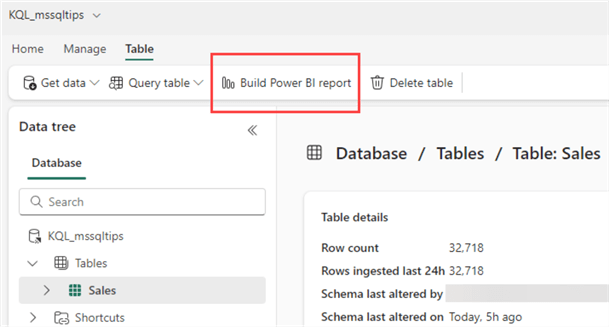
By clicking Build Power BI report, a pop-up opens where you can design a new report using either the table from the database or the result from a KQL query:
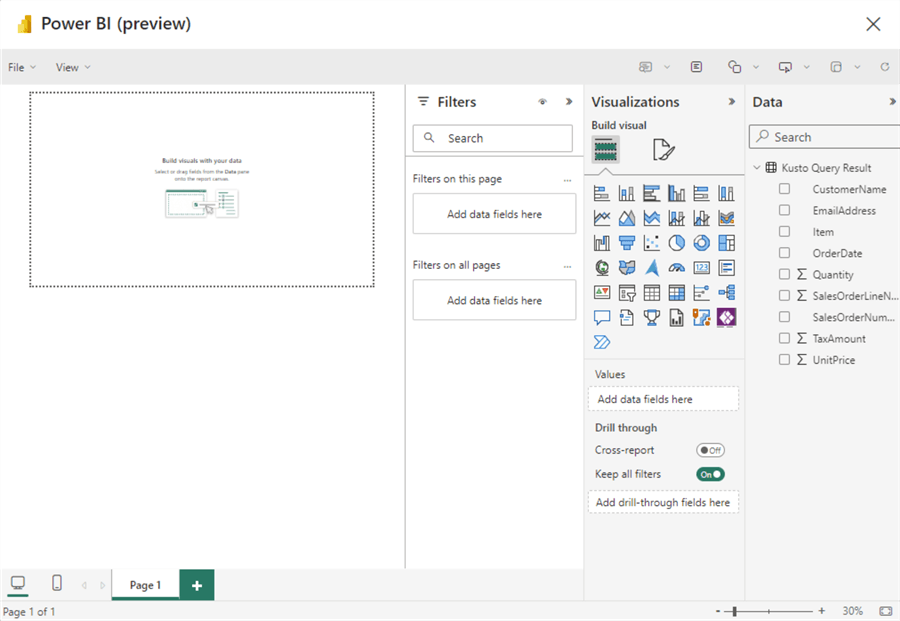
At the time of writing, this functionality is in preview, and the pop-up window is relatively small, which doesn't lead to a great design experience. Hopefully, this will be improved when Fabric goes into general availability.
Conclusion
In this tip, we saw how to quickly get started with the KQL database service in Microsoft Fabric. KQL databases are a continuation of Azure Data Explorer (or Synapse Kusto Pools) in Fabric. They allow you to perform time-series analysis on large amounts of data, and KQL databases can ingest streaming data as well.
Next Steps
- To follow along with this tip, you can download the sample data set here.
- You can find more Microsoft Fabric tips in this overview.
- To familiarize yourself with KQL and Azure Data Explorer, here are some
valuable resources:
- ADX in a Day workshop
- Kusto Detective Agency
- A cool demo of the power of ADX using the Power BI log data: The Most Powerful Azure Service You've Never Heard Of
About the author
 Koen Verbeeck is a seasoned business intelligence consultant at AE. He has over a decade of experience with the Microsoft Data Platform in numerous industries. He holds several certifications and is a prolific writer contributing content about SSIS, ADF, SSAS, SSRS, MDS, Power BI, Snowflake and Azure services. He has spoken at PASS, SQLBits, dataMinds Connect and delivers webinars on MSSQLTips.com. Koen has been awarded the Microsoft MVP data platform award for many years.
This author pledges the content of this article is based on professional experience and not AI generated.
View all my tips
Article Last Updated: 2023-11-28


