By: Ron L'Esteve | Updated: 2024-05-13 | Comments (2) | Related: > Microsoft Fabric
Problem
With Microsoft Fabric now generally available, organizations are interested in implementing this flagship Unified Data and AI Intelligence Platform for several reasons. Its native integration within the Azure stack provides seamless and secure access to widely used technologies for data integration, business intelligence, and advanced analytics. Microsoft Fabric's storage and compute capacity is utilized by resources within this unified analytics platform, including storage repositories, such as data warehouses and data lakes, and compute capacity for Power BI, Pipelines, DW processing, and artificial intelligence (AI)/machine learning (ML) workloads.
Fabric capacity can be purchased on Azure with a pay-as-you-go model, and a 60-day free trial (64 CUs) is offered to test the platform. Organizations that have an existing Power BI Premium capacity can easily enable access to Fabric by using the Microsoft Fabric admin switch. Enabling Fabric in Power BI Premium as opposed to Azure Portal creates a problem: there is no easy way to monitor and set alerts on your Fabric capacity metrics in the Azure Portal.
Solution
The Microsoft Fabric Capacity Metrics App is designed to provide monitoring capabilities for Fabric and Power BI Premium capacities. Data Activator in Microsoft Fabric is a no-code tool that automatically monitors data in Power BI reports and Eventstreams items and takes actions, such as alerting users or initiating Power Automate workflows when the data hits certain thresholds or matches specified patterns. When combined, the Metrics App and Data Activator provide a comprehensive suite of tools for monitoring and taking necessary administrative action to control your organization's Fabric capacity. In this article, you will learn more about both the Metrics App and Data Activator for Microsoft Fabric.
Installing the Metrics App
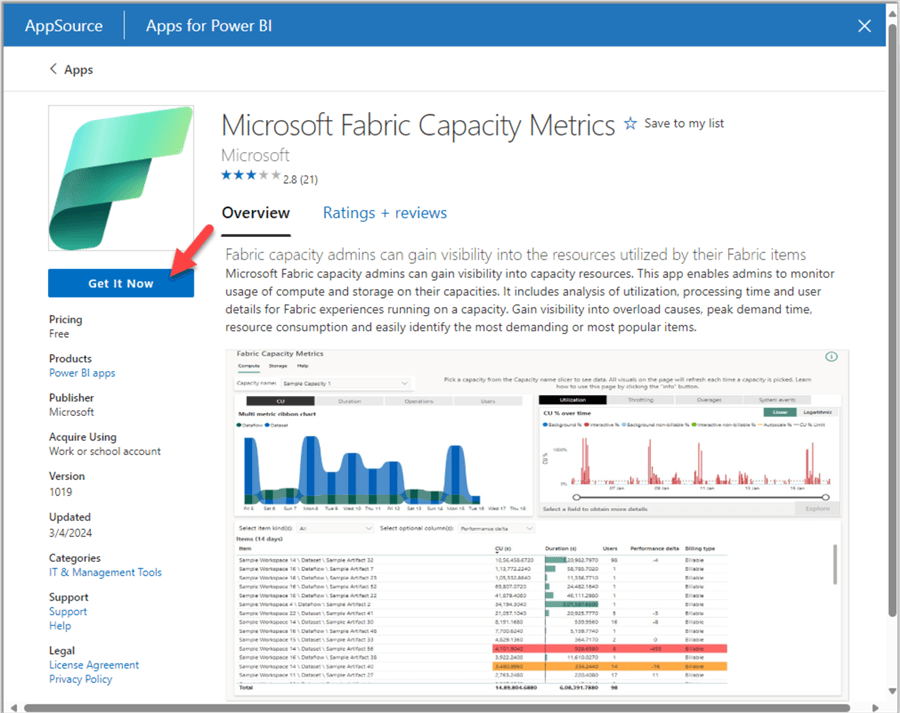
The Metrics App can be installed from within your Power BI apps by searching for 'Fabric.'
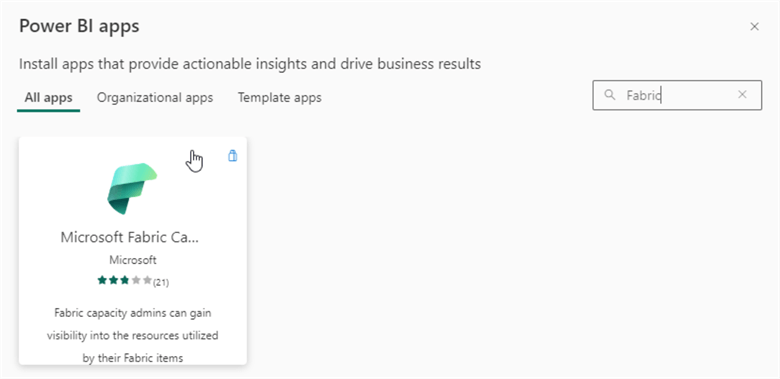
Note: The Metrics App is free. However, you need to be a Fabric Capacity Admin to install this app. You can learn more about the detailed steps required for installing and upgrading the Metrics App from Microsoft's article: Install the Microsoft Fabric capacity metrics app.
After the installation, remember to connect your data by providing your Capacity ID to the app. You can find the capacity ID in the URL of the capacity management page. In Microsoft Fabric, go to Settings > Admin center > Capacity settings, then select a capacity. You also need to provide your Authentication Method (OAuth2 is the default) and set your privacy level. Select Organizational to enable app access to all the data sources in your organization.
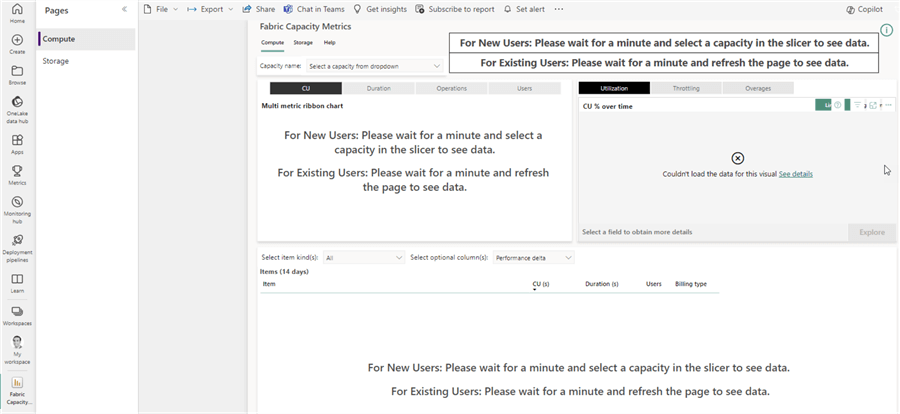
As the Metrics App loads for the first time, you might see a page like the figure below. Once loaded, you can select your organization's capacity from the 'Capacity Name' drop-down. Remember to consistently check for new upgrades to the Metrics App to stay up-to-date with the latest version.
Understanding the Metrics App
The Metrics App renders as a Power BI report within your Fabric workspace. The app contains two pages: Storage and Compute.
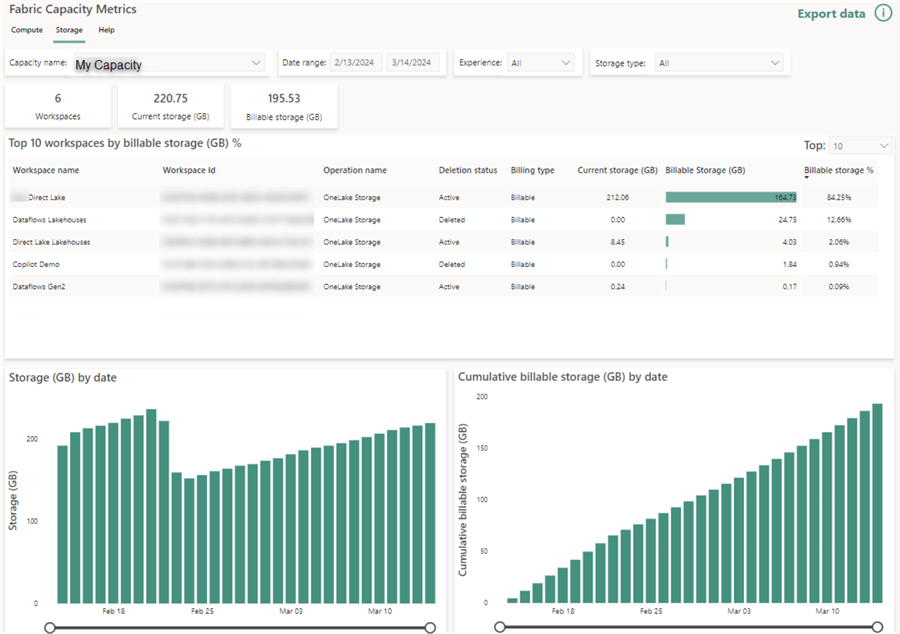
The Storage page provides insights into storage (GB) by workspace. This can be useful to identify storage trends, high-cost workspaces, and those reaching storage capacity limits. You also gain access to OneLake in Fabric, a unified, logical data lake for your organization. It is like OneDrive for your analytics data, improving collaboration by eliminating the need to manage multiple resources. Each workspace in OneLake is part of a capacity tied to a specific region and billed separately. Built on Azure Data Lake Storage Gen2 (ADLS Gen2), OneLake supports any file type and automatically stores all Fabric data items in Delta Parquet format. It is compatible with existing ADLS Gen2 applications, including Azure Databricks.
The Compute page is useful for Fabric Admins to troubleshoot and monitor capacity usage. Microsoft has a detailed article to help you understand the Metrics App compute page. You can also learn more about Fabric capacities from Microsoft's blog.
Capacity management in Fabric involves features like bursting and smoothing to optimize performance and manage compute spikes without throttling, ensuring efficient job execution. Bursting allows you to consume extra compute resources beyond what you have purchased to speed up the execution of a workload. For instance, a job that would normally run on 64 Capacity Units (CUs) and complete in 60 seconds could, with bursting, use 256 CUs to complete the job in only 15 seconds.
On the other hand, smoothing offers relief for customers who create sudden spikes during their peak times while they have a lot of idle capacity that is unused. It simplifies capacity management by spreading the evaluation of compute to ensure that customer jobs run smoothly and efficiently. For example, if a customer's peak usage is at 10:00 AM and they have idle capacity at 3:00 PM, smoothing would distribute some of the compute from 10:00 AM to 3:00 PM, ensuring a more efficient use of resources.
The visuals within the Compute page of the Metrics App give insight into when the largest capacity unit spend occurred. Selecting a day within the 'Multi metrics ribbon chart' also enables the other visuals and tabular data to filter for that day.
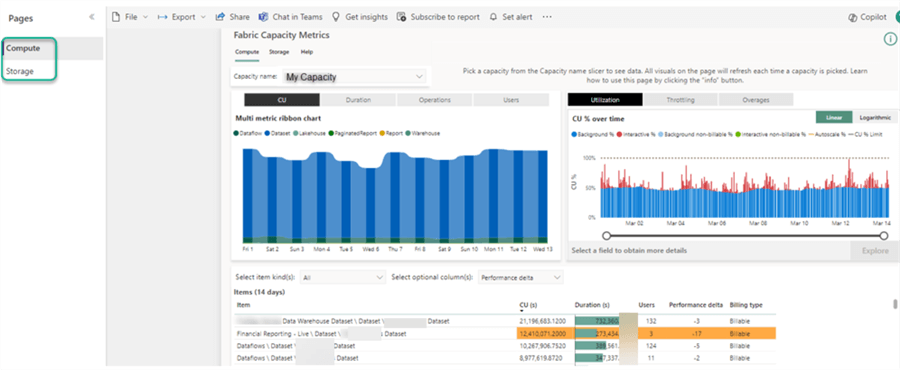
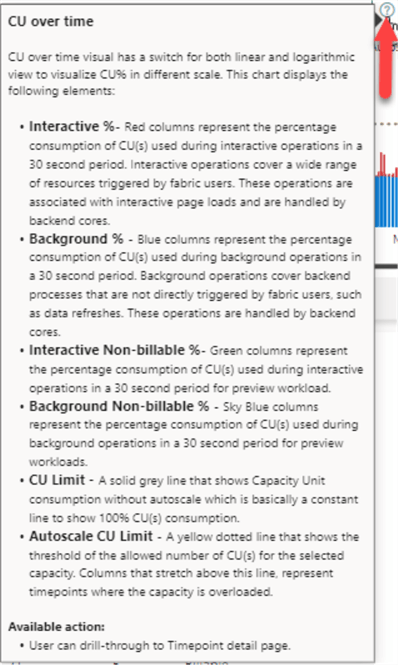
By hovering over the '?' icon within each card on the report (shown below), you will see detailed definitions of the metrics that are displayed on the app. The CU % over time visual shows hourly capacity usage, including processing time, operations, and users. It also displays CU usage over time and the percentage of CU consumption for different operations and capacities. The app helps monitor capacity consumption, providing metrics like storage usage and CU seconds consumption, aiding in capacity management decisions. It is important to note that Interactive % (Columns in Red) is smoothed over 5 minutes, and Background % (Columns in Blue) is smoothed over 24 hours. A significant amount of blue could mean that background operations need to be optimized, and red could mean bad models, DAX, high concurrency, etc.
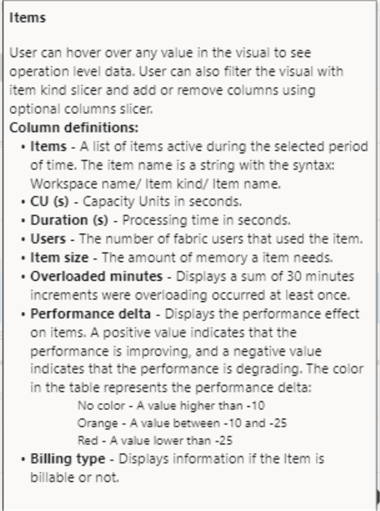
The Items visual is a matrix table that provides detailed information about each item's usage in your capacity. It displays metrics such as CU processing time in seconds, the number of operations that took place, and the number of users that performed operations. This visual helps you understand the consumption of CU seconds for a specific item over the past 14 days. It is a valuable tool for monitoring and managing your capacity resources effectively.
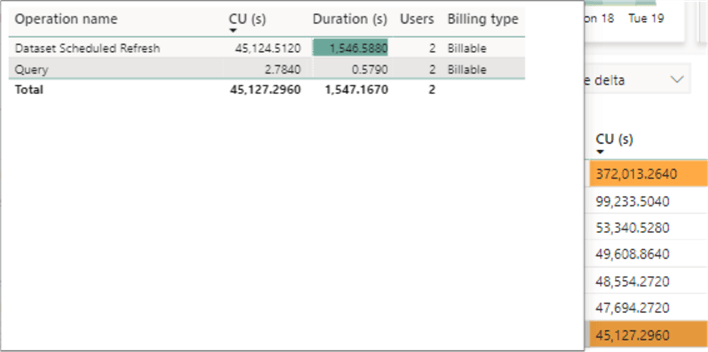
You can also hover over the tooltip details within the 'Items' section to know the operation level CU usage. If the CUs are mostly tied to Queries, you might need to explore optimization opportunities for data models, DAX, and report design. On the other hand, if CUs are higher for Dataset refreshes, then you might need to think about enhancement opportunities around incremental refreshes, alternate data connections to OneLake, and leveraging the new Fabric Mirroring capabilities to minimize or eliminate excessive dataset refreshes.
Enabling Data Activator
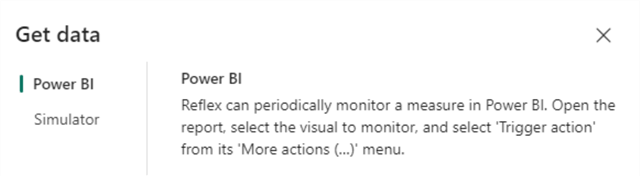
This section will describe how to enable notifications and alerts on metrics and visuals within the Metrics App with Data Activator. Fabric Data Activator is a no-code feature in Microsoft Fabric that automatically takes actions when patterns or conditions are detected in changing data. It monitors data in Power BI reports and Eventstreams items, and can trigger actions such as alerts or Power Automate workflows when data hits certain thresholds or matches patterns.
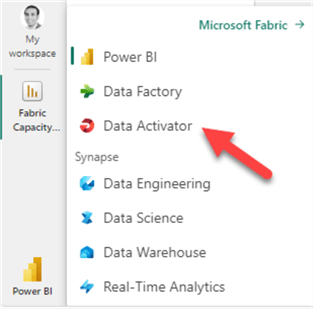
Within Data Activator, you can create a Reflex, which is a rule that monitors data and triggers actions when certain conditions are met. Remember that you will need a premium Fabric workspace to enable this.
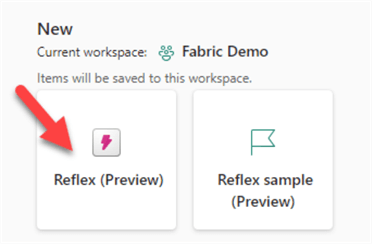
Reflex is built into Power BI by opening your report and selecting the 'Trigger action' to create a new Reflex.
For example, you can navigate to 'More actions (…)' within your 'CU % over time' visual and then 'Trigger action' to set an alert to receive an email when the CU percentage exceeds 100%.
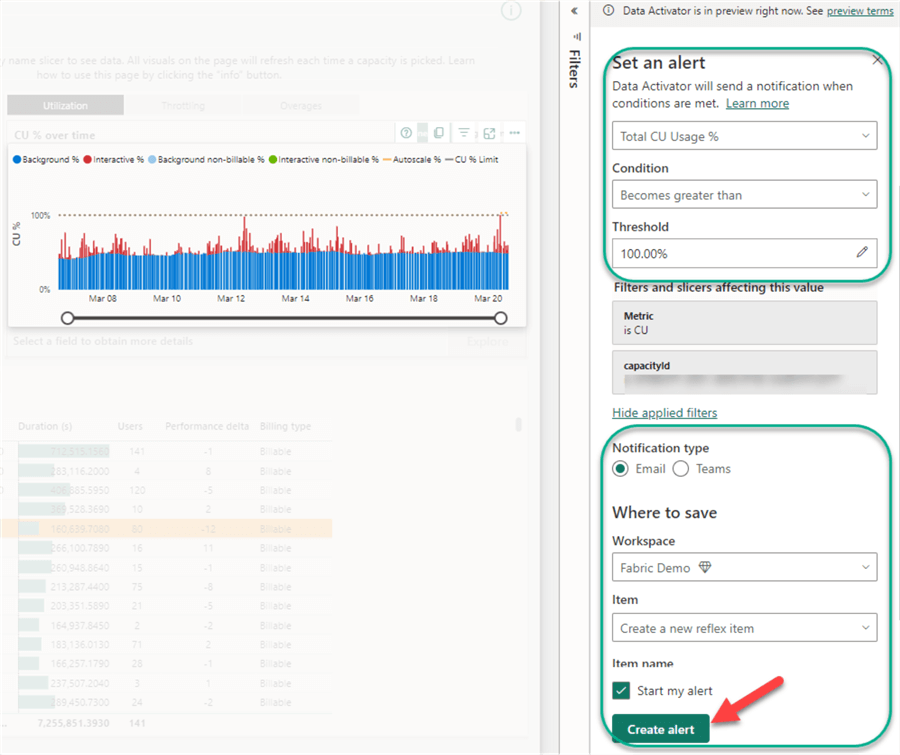
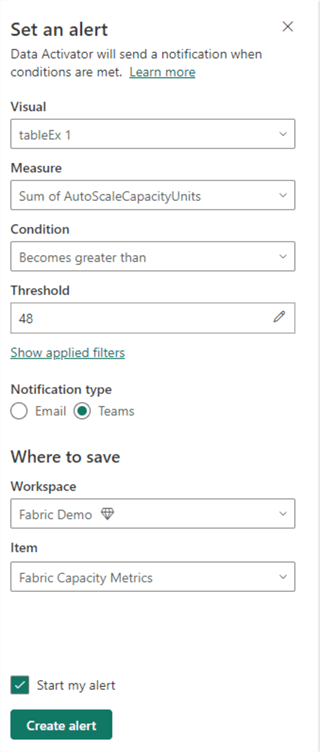
You can do the same for other measures, including those in the 'Items' card, to create automated alerts for selected measures and define conditions, thresholds, and notification types (email or Teams).
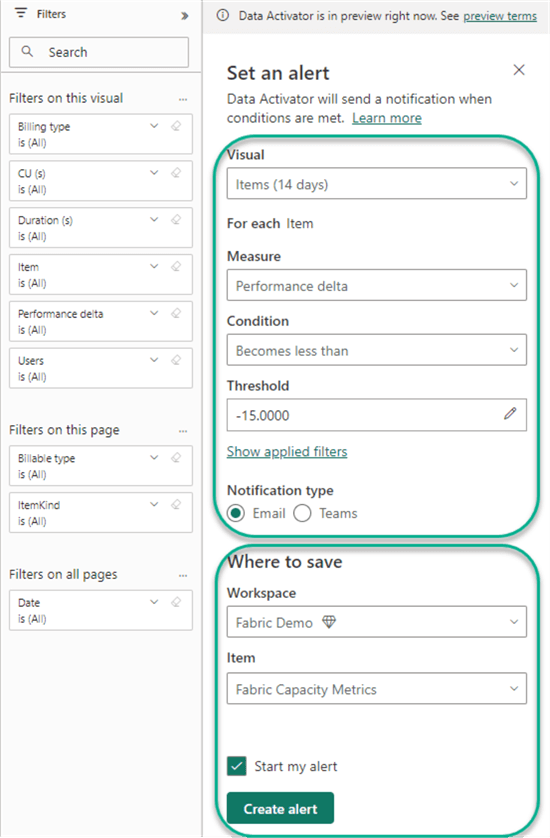
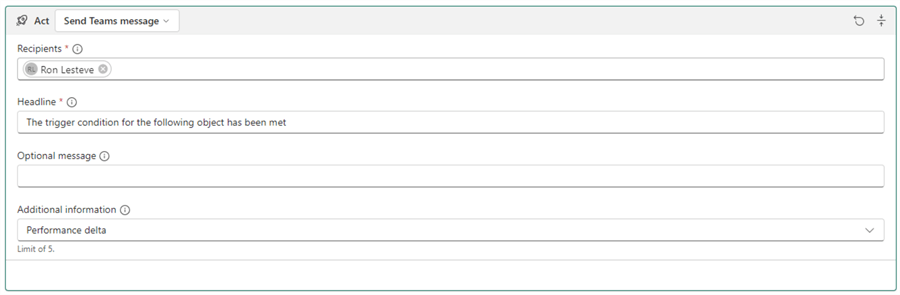
Depending on your Notification Type selection, you can add one or more recipients, including a header, optional message, and additional information.
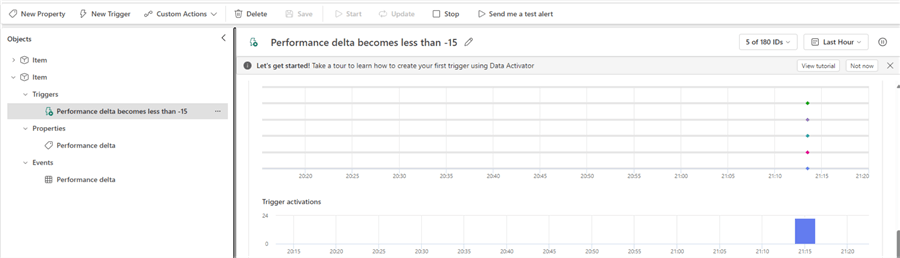
Once the alert is started, a Data Activator Reflex will be created that allows you to monitor the alert in real time with the built-in visuals.
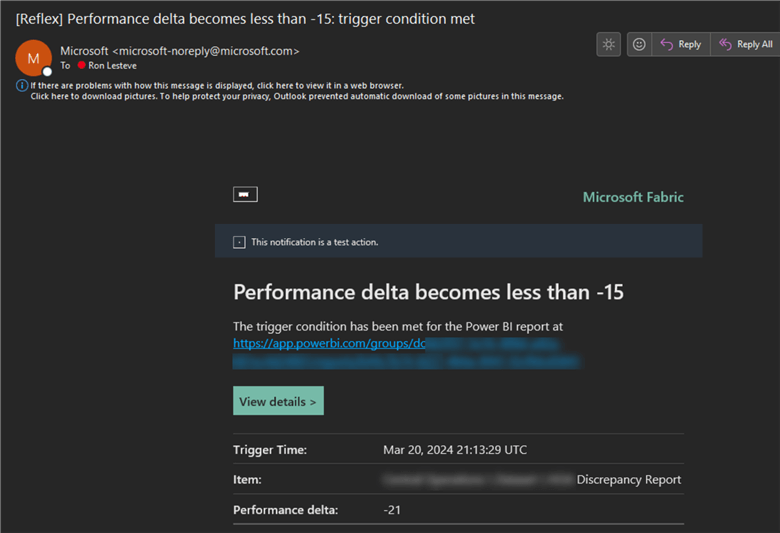
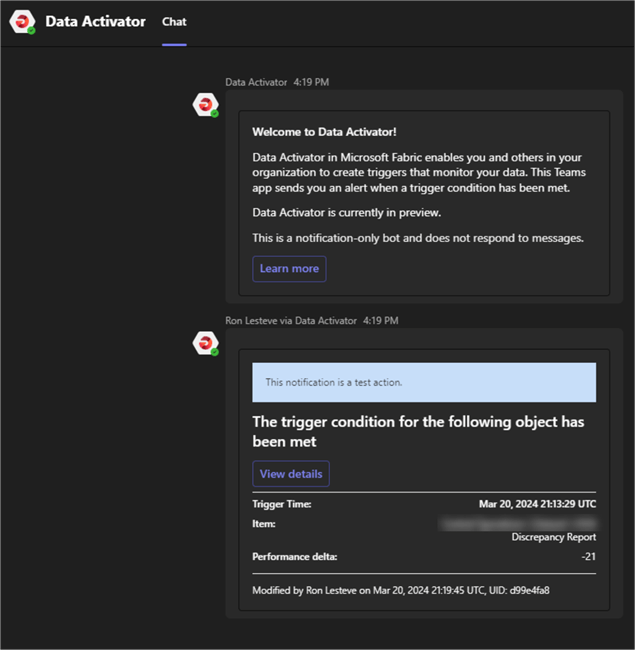
When the trigger condition is met, you will get an email with the alert details and a link to open the report in question.
Similarly, if you opt to receive a Teams notification, then you will receive a Teams message with the alert.
Customizing the Metrics App
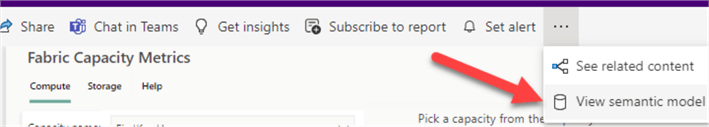
Finally, you have the option to view the semantic model of the Capacity Metrics App, allowing you to build your own custom reports or create other custom processes using the data model.
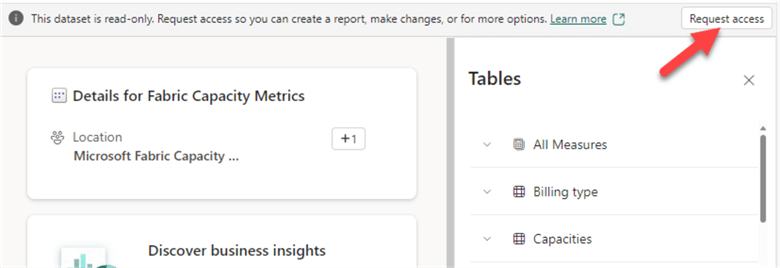
You may need to gain access to the semantic model by clicking 'Request access,' which can be granted by your Fabric Admin.
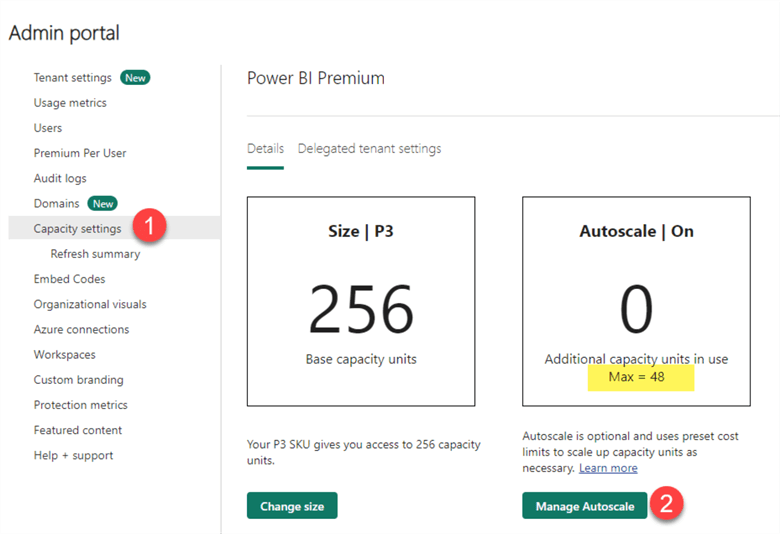
An example of a custom report could be an alert being received for CUs that exceed the maximum autoscale capacity units. You can locate your allocated base and Autoscale capacity units within 'Capacity settings' in the Admin portal. If you have a P3 Power BI premium SKU with 256 base CUs and additional 48 Autoscale CUs available, then you could create a report that sends an alert when your Autoscale CUs exceed 48.
To create this custom report and alert, you will need the following data points: sum of autoscale capacity units by Timepoint.
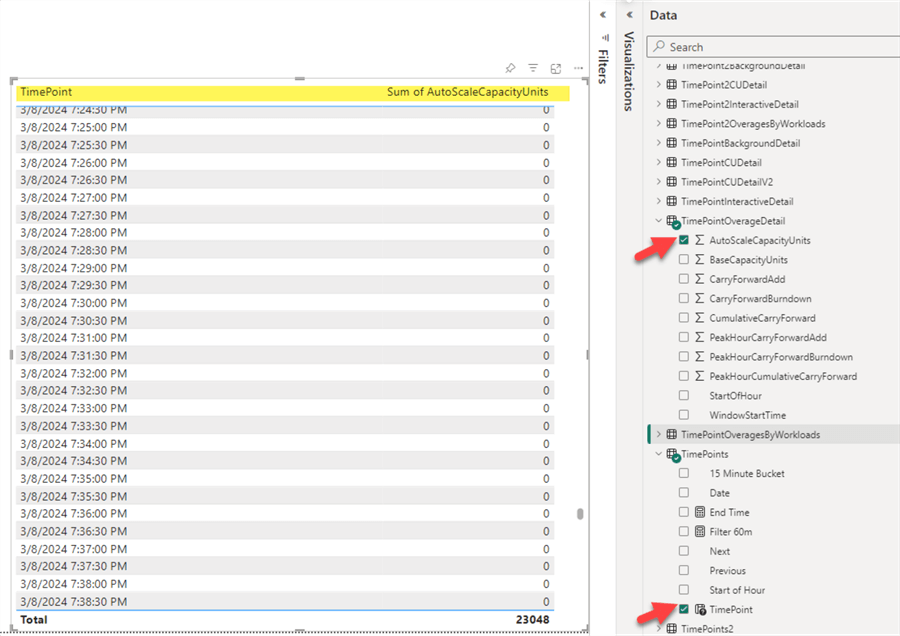
Once the report is created, you can set an alert when the autoscale CU threshold of 48 is exceeded.
You are now equipped with the skills to monitor your Fabric compute and storage capacity with the Fabric Metrics App. You also learned to access the Fabric Metrics semantic data model to create custom reports and alerts. Finally, using Data Activator and Reflex, you learned to create and trigger email and Teams alerts for metrics that are out of bounds for pre-defined thresholds.
Next Steps
- Learn how to Enable Microsoft Fabric for your organization - Microsoft Fabric | Microsoft Learn
- Read about What is the Microsoft Fabric Capacity Metrics app? - Microsoft Fabric | Microsoft Learn
- Learn more about Data Activator: Introduction to Data Activator - Microsoft Fabric | Microsoft Learn


About the author
 Ron L'Esteve is a trusted information technology thought leader and professional Author residing in Illinois. He brings over 20 years of IT experience and is well-known for his impactful books and article publications on Data & AI Architecture, Engineering, and Cloud Leadership. Ron completed his Master�s in Business Administration and Finance from Loyola University in Chicago. Ron brings deep tec
This author pledges the content of this article is based on professional experience and not AI generated.
View all my tips
Article Last Updated: 2024-05-13