By: Kenneth A. Omorodion | Updated: 2024-05-16 | Comments | Related: > Power BI
Problem
Sorting values on a Power BI visual is a common requirement for reporting. For example, it is standard practice to sort months from January to December when months are represented in a visual. This might also be required in a slicer visual. In both cases, it is easy to sort when it's a continuous value, like months, years, quarters, or alphabetically.
However, in Power BI, business users might require a slicer visual with string values to be ordered in a way that makes it easier for them to make a slicer selection based on what they want to view on a report page. The issue here is that string values are not continuous in nature, and we cannot leverage the usual sorting approaches. This tip will demonstrate this problem and an approach to resolve it.
Solution
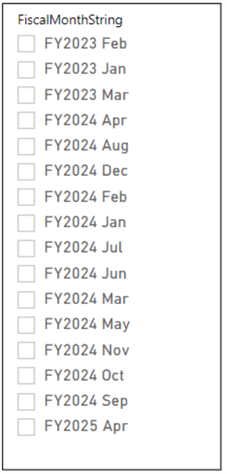
Review the image below. It contains string date values. Power BI does not see them as a continuous value when sorting by both Fiscal Year and Month at the same time.
The image below shows what we would like to achieve: sorted values assuming the fiscal year starts in April each year.
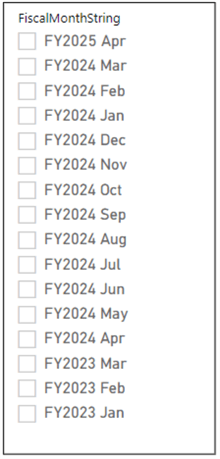
Consider the sample dates table below. To create a "FiscalMonthString" column (like the image above), you first need to create a "FiscalYear" column, then concatenate it with the "MonthName".
The steps to achieve this requirement include:
- Add a Fiscal Year column to the dates table.
- Add a Fiscal Month number column to the dates table.
- Create and add a column for concatenated Fiscal Year and Fiscal Month Number.
- Add a sorting column based on a logic.
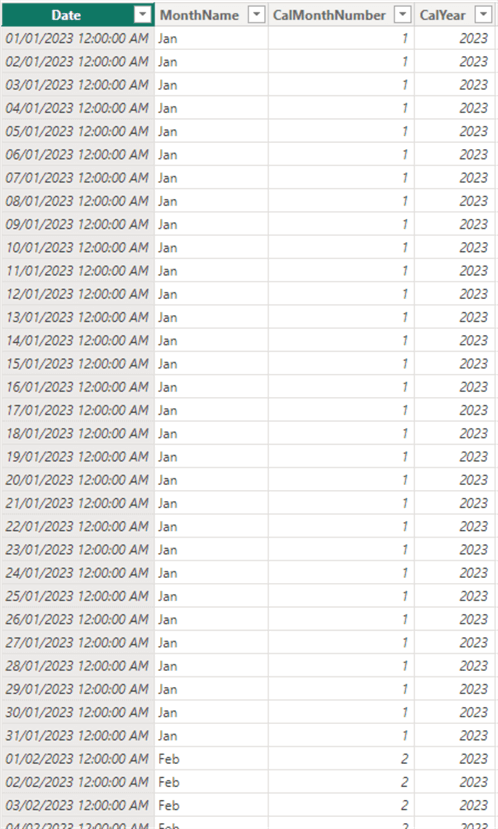
Step 1: Add a Fiscal Year Column to the Dates Table
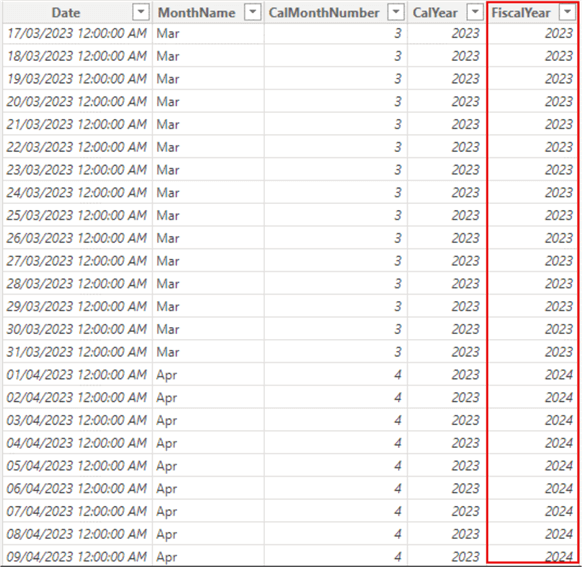
The DAX code below can help create a "FiscalYear" column assuming the fiscal year start month is April each year:
FiscalYear =
        VAR _FiscalYrStrt = 4 //Update as appropriate
        RETURN
            IF(DimDate2[CalMonthNumber] >= _FiscalYrStrt,
            DimDate2[CalYear] + 1,
            DimDate2[CalYear])
The dates table should now look like the image below.
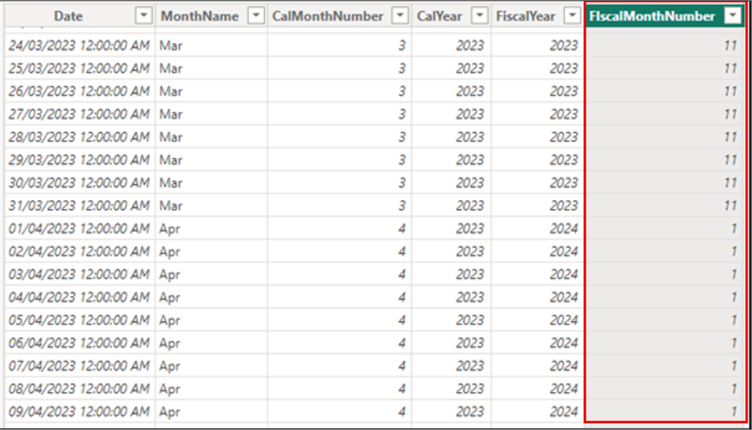
Step 2: Add a Fiscal Month Number Column to the Dates Table
To add a Fiscal Month Number column, use the simple DAX code below:
FIscalMonthNumber =
    VAR _FiscalStartMth = 4
    VAR _Month = MONTH(DimDate2[Date])
    VAR _Output = IF(_Month >= _FiscalStartMth,
                    _Month - _FiscalStartMth + 1, _Month + 12 - _FiscalStartMth)
RETURN
    _Output
The dates table should now look like the image below.
Step 3: Create and Add a Column of Concatenated Fiscal Year and Fiscal Month Number
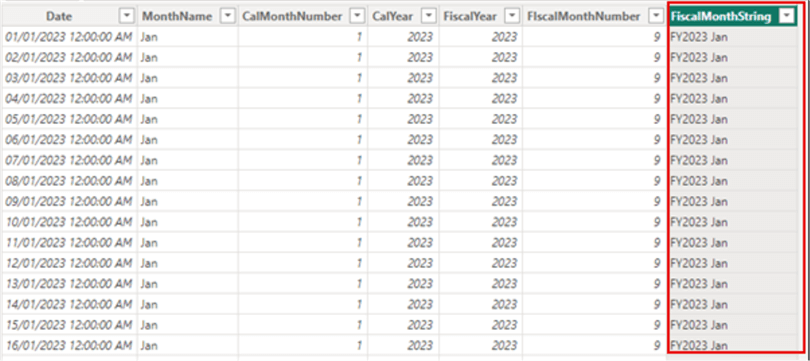
To do this, use the DAX code below:
FiscalMonthString = "FY"&DimDate[FiscalYear]&" "&DimDate[MonthName]
The output of this column is below:
If the "FiscalMonthString" is used in a slicer, it will not automatically sort as expected; it will look like the image below. However, the requirement is for the values to sort based on the Fiscal Year and Month at the same time.
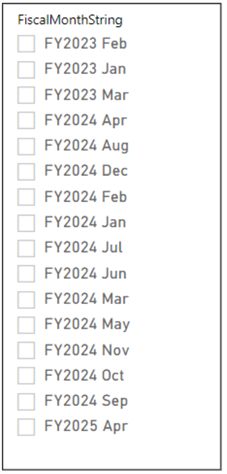
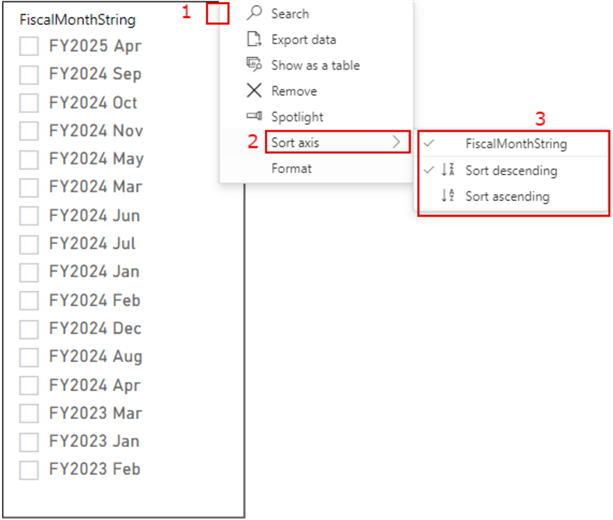
As you can see, the values are not in any particular order, and it becomes even worse with more dates available on the dates table. Most users will initially try to sort the values by clicking on the ellipses at the top-right of the slicer visual and selecting "FiscalMonthString" and "Sort descending" (see below). But that won't work either, as it only sorts the months in alphabetical order.
Another approach that will not work is to sort it by the Month Number column, as seen below. This is sorting by Month Number only and does not consider the most recent month based on the current fiscal year.

So, what is a good approach to solve this business requirement? This takes us to Step 4.
Step 4: Add a Sorting Column Based on a Logic
In this step, you apply a logic while creating a column in DAX:
IsSortingCol =
    VAR _YearPart = DimDate2[FiscalYear]
    VAR _MonthPart = DimDate2[FIscalMonthNumber]
RETURN
    _YearPart * 100 + _MonthPart
The above DAX code simply creates a new column called "IsSortingCol", by pulling the "FiscalYear" and multiplying it by 100 for separation purposes and combining it with the "FiscalMonthNumber" numeric value.
The output of the above DAX code is as seen in the dates table below.
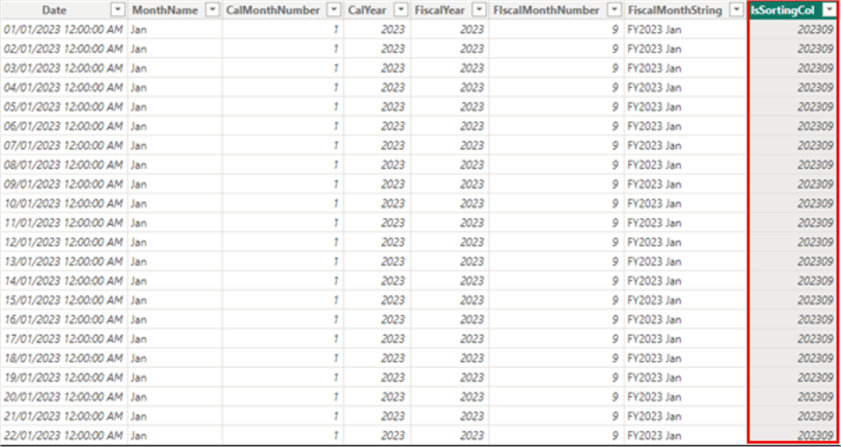
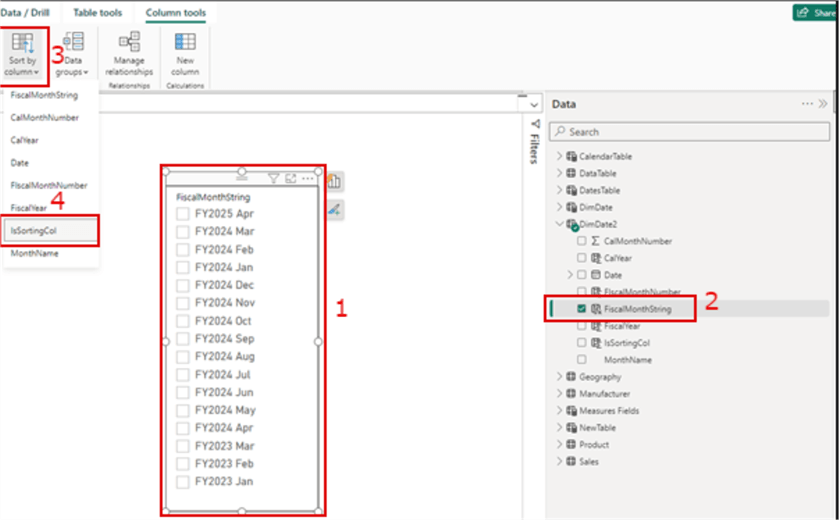
Now, we are ready to sort the values on the slicer again using this new "IsSortingCol" column. To do this, select the slicer visual first and click on the column name within the table. Next, on the "Sort by column" dropdown within the top ribbon, select "IsSortingCol" from the list, as seen in the image below.
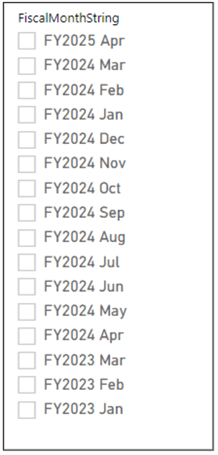
As you can see, the slicer visual is now accurately sorted as required.
In this tip, we have successfully demonstrated an approach to sort string columns on a slicer visual in Power BI. It would be great to hear from others regarding how they have approach this in their own experience. Although this might not be a common requirement in designing a report in Power BI, I personally have had this requested on multiple occasions across multiple projects.
Next Steps
- See this YouTube video from Leila Gharani, Power BI Slicers - A Step-by-Step Tutorial for All Types to Improve Data Analysis.
- Read more on Slicers in Power BI.
- Read this article: How to Create Date Dimension Tables from Text Columns.
Learn more about Power BI in this 3 hour training course.
About the author
 Kenneth A. Omorodion is a Business Intelligence Developer with over eight years of experience. He holds both a bachelorís and masterís degree (Middlesex University in London). Kenneth has the MCSA, Microsoft Data Analyst - Power BI and Azure Fundamentals certifications. Kenneth is a Microsoft Certified Trainer and has delivered corporate training on Power BI, SQL Server, Excel and SSRS.
This author pledges the content of this article is based on professional experience and not AI generated.
View all my tips
Article Last Updated: 2024-05-16


